
Best Manual Trading Systems in Forex
Metal hinges and electronic arms, these are usually the things that first come to mind when you think about robots. You may be surprised that some people use robots to trade. In fact, robots can also play a huge role in Forex trading. No, these robots aren’t large hunks of metal tapping away at computer screens in a basement somewhere. Rather, the robots that we are referring to, are computer programs that are designed to execute trades on your behalf. This type of trading is referred to as automated trading.
The main advantage that automated trading offers is that it is generally free of the little errors that we humans make sometimes in our trading. An automated system is disciplined and clinical in how it executes the trading plan. It is not affected by human emotions like fear and greed. It will not make errors like placing a sell instead of a buy or using the wrong lot size in your trades, and it will always place the stop loss and take profit levels at the right place. Another huge advantage that this way of trading offers is that it never gets tired, so it can monitor multiple currency pairs 24/7, so that you will never miss a signal.
Now with all these advantages you may be wondering, why should you even bother with trading manually? Surely it must be easier to simply install an automated system and let it make money! Well, simply put, automated systems are only as good as their programmers. This means that the system can only do all the great things we mentioned before if it is programmed properly. This means that if you use one, you are placing a lot of trust in someone else. Essentially you are risking your hard earned money on the hope that the programmer who designed the system did so perfectly. Also, there is one basic thing that always drives many traders to make their trades manually instead of using a robot. The automated trading system cannot think for itself.
Unlike the robot, the manual trader is able to analyze new information, think critically and make decisions accordingly. If the market is moving sideways, he knows when to stop taking signals. When a currency pair has gone extremely volatile because of a news release, he knows to avoid that pair.
The Forex market is constantly changing and a trader needs to be able to react to the sudden changes that may happen. A robot cannot see if the market is moving haphazardly or at a bad pace. It cannot see bad quality trades. If a trader wants to have quality and control in his trading, the only way that he can do this with certainty is to simply use a forex manual trading system.
The Sea of Confusion
Those who are looking for those two elements, quality and control, will also be people who are willing to put in the time and effort to learn. But, the question is, where do they start? A quick google search of the best ways to trade manually, will surely leave just about anyone’s head spinning. There are literally hundreds of forum posts and websites all claiming to have the insight into the best manual forex trading systems. Some of them will even try to sell you the knowledge.
The first and most important thing that any new trader needs to know is that there is no holy grail system for day trading. There is no, one system that will give you the best trades all the time. Even if you follow the system perfectly, there will be some trades that will not go according to plan. This means that you will have some losing trades even if you are using the best forex manual trading system.This is why having a risk:return ratio for every trade is very important. It is also just as important to ensure that you follow your trading system accurately. As we are human, and prone to making mistakes, we suggest avoiding the complicated trading systems. Stick to forex manual trading systems that are simple, logical, and transferrable across timeframes. If you use these as measures to choosing your manual systems, then the list of systems that you can use becomes much smaller.
These are the top manual forex trading systems that we suggest you check out:
Daily Fibonacci Pivot
This strategy uses the Fibonacci retracement levels and the daily pivot points to find trade entries. The Fibonacci sequence is a popular trading tool that shows the important levels where price may gather support or resistance. Using this as a way of entering a trade, allows the trader to determine the best level to either enter or exit a trade on a retracement. Used in confluence with the daily central pivot point, it becomes a powerful trading system.
In order to follow this manual forex trading system, a trader must:
- Identify a currency pair where the previous day’s range is greater than the average range of the last 5 periods. (The range is found by comparing the price low to the price high for the period. To calculate the average for the past five periods, simply subtract the period high and low for the last five periods, add these numbers and divide by five.)
- Plot the daily central pivot point on the chart. ( This can be found out with a quick look at websites which calculate pivot points for the hour, 4 hour and daily charts).
- At the start of the current daily session draw Fibonacci lines:
From the previous period’s high to low, if the price is currently below the daily central pivot
From the previous period’s low to high, if the price is currently above the daily central pivot - Look for the area where the daily central pivot and the Fibonacci lines merge/ come together. We are looking for merges at the 38%, 50% or 62% Fibonacci levels. If this is satisfied, place your trade entry at this point. If price retraces down to meet the level, then you place a Buy. If price retraces up to meet the level, then you place a Sell.
- Stop loss levels should be placed about one Fibonacci level away from the point of entry.
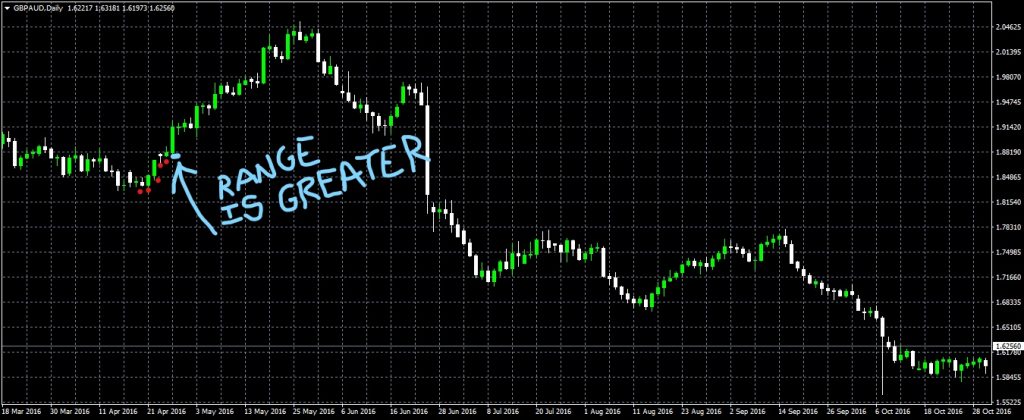
On this GBP/AUD daily chart, we can see where the candle indicated in blue has a greater range than the average range of the last five periods which are indicated by the red dots.
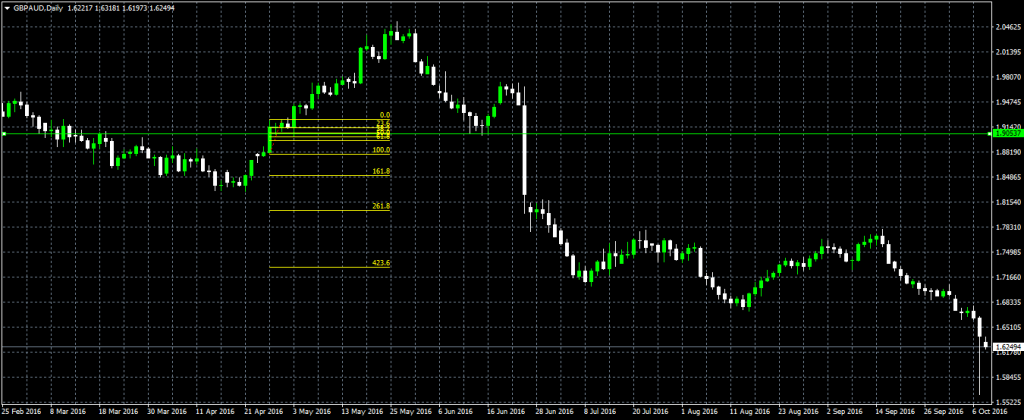
We find the open, high, low and close prices for that candle indicated in blue, and punch it into the pivot point calculator. The daily central pivot point calculated is valued at 1.90537. We put that on the chart. (this is indicated by the green horizontal line). Then, since the price is above the daily central pivot point we draw the Fibonacci lines from the bottom of the candle to the top. It would look like the picture below.
To get a better view, we switch to the H4 chart and zoom in.
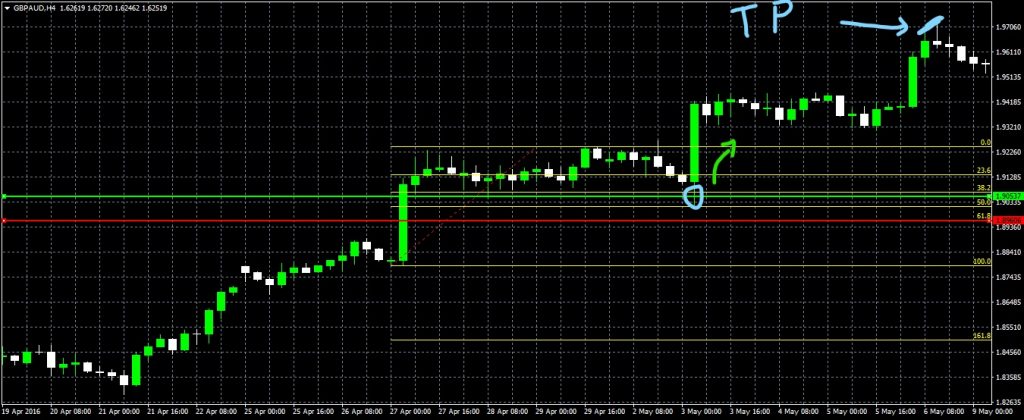
The daily central pivot point is shown in green and it converges with the 38% line (the convergence is circled in blue). We would watch price to see how far it would go. In this instance price also almost touched the 50% line, therefore it would have been wise to place the stop loss (shown in red) at the 62% line. We can see price shoot up from there (shown by the green arrow), where we could have taken our profit at the area highlighted by the blue arrow.
The Bollinger Band Bounce
This is one of the best forex manual trading systems that is best suited for a market that is ranging. Many traders believe that trading the market when it is moving sideways is something like committing trade suicide. While there are risks with trading the ranging market, with the right strategy it is not impossible to make a profit.
In a ranging market, the Bollinger Bands, act like a type of elastic bands where when price moves towards the outer bands, it encounters resistance and bounces back towards the opposite band. This way of trading is very much like scalping, where the trader enters the market immediately at the signal, and has a tight stop loss. The profit target is set at the outer bollinger band opposite the entry point.
The following are the steps involved in trading the Bollinger Band Bounce:
- Identify if the market is a ranging market or a trending market. (If it is a ranging market continue to step two.)
- Watch price move towards the outer band. As soon as price shows a rejection signal (a candle that bounces back from the outer band), make an entry. This means making a buy on the lower outer band, or a sell on the upper outer band.
- Set your stop loss tightly outside the outer band where you entered the trade. Set your take profit level at the other outer band opposite to your trade entry.
- In order to keep risk low, move your stop loss level to break even when price moves past or touches the middle Bollinger Band. This is done just in case price decides to retrace when it reaches the middle band and not go all the way to the take profit level.
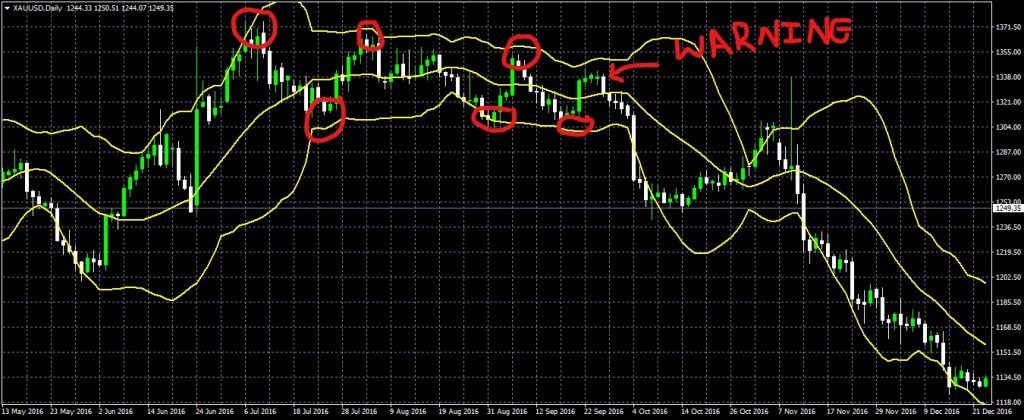
As shown on this XAU/USD daily chart, the market became trapped in a range. The areas circled in red are those areas indicating where trades could have been made using the Bollinger Band Bounce strategy. The area being indicated by the red arrow with the word “warning”, indicates an area where caution should be observed. It indicates tiny candles with short real bodies that did not reach the top outer band. Instead it was followed by a longer bearish candle that retraced to the middle band, giving an indication that the range may be ending soon. This was later confirmed by the strong bearish movement that followed. (This is why it is important to move your stop loss to breakeven, so that if this happens you do not close out your trade in loss).
As a side note, because of the sensitive nature of this system, it is best used in a market that is not volatile. This system should not be used on pairs that are prone to spike movements, or when there is an expected fundamental news announcement. This type of system also works best with some sort of confirmation at the outer bands. This can be through candlestick patterns, support/resistance levels or even Fibonacci levels.
EMA CrossOver
The exponential moving average crossover (EMA crossover) is one of the manual forex trading systems that is based on price action. This means that for this strategy we will not be using off-chart indicators like MACD, stochastics or RSI. Instead we will be using the 20 EMA indicator that will remain on chart. Candlestick signals, support and resistance levels and pivot points can be used to help strengthen trade entries, to confirm entries and they can also be used to plot exit points.
What is special about the EMA crossover is that it is a strategy that is completely transferrable. It can be used on any time frame, and on any currency pair. This makes it a very popular option among traders.
As a word of caution, it is best not to trade this strategy during fundamental news announcements because the high volatility can affect how reliable your entries are. We suggest waiting until price has settled to begin any trade using this strategy.
How to trade the EMA crossover:
- Look for a price movement on a currency pair that is either above or below the EMA and comfortable in that space. This means that the price should not be chopping up and down, with the 20 EMA line dividing it like a knife. Instead price should be obviously on one side of the line.
- This would be a good time to plot your support and resistance lines or pivot points on your chart. You may use them to mark possible entry points or exit points for your future trade.
- Wait for the price to retrace towards the EMA line and test it. (If price was clearly above or below the line it is likely that price will reject the attempt to cross the EMA line and return to its original direction.)
- If price does retest the EMA line, then we wait for a rejection candle or candlestick pattern,( eg. the doji, or the hammer or the hanging man etc.). For this candlestick signal, the candle must close on the same side of the EMA (It must not cross over/break the line). If this is formed, we have trade confirmation.
- If price was above the EMA line, then we place a buy, if it was below we place a sell. If you are taking a buy, you may place your stop loss a little below the low of the rejection candle. If you are placing a sell, you may place your stop loss a little above the high of the rejection candle above the EMA line.
- Your trade will be made stronger if it was in on a level of support or resistance, or on a period pivot point. If you placed a buy, you may set your take profit level at the next area of resistance. If you placed a sell you may set your take profit level at the next area of support.
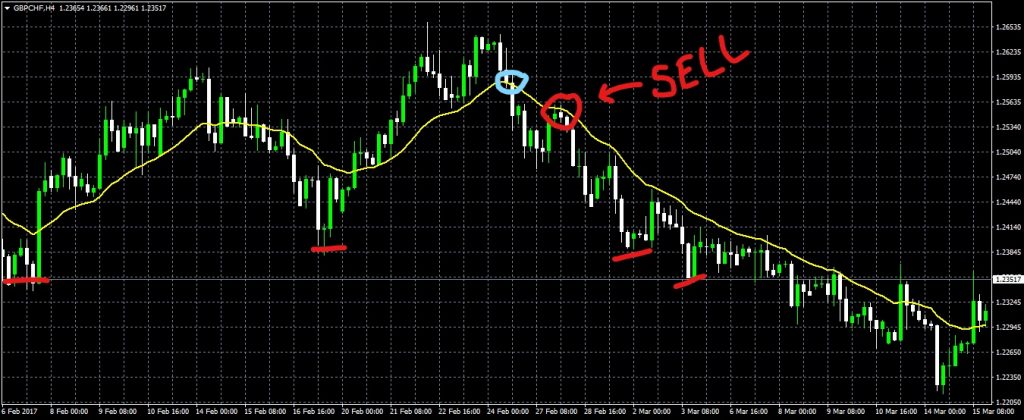
As this picture shows on this GBP/CHF H4 chart, the area in blue is where price broke below the EMA line to form a new trend. The area circled in red shows where it retraced to test the EMA line, and formed a rejection pattern that closed below the EMA line. This made it a viable sell option. If we placed that sell, we could have taken profit at the previous lows which are underlined in red on the left. These levels are also highlighted in red on the right where you could have exited the trade.
Practice Makes Perfect
Like with all manual forex trading systems, the success of the trader using the systems discussed, depends on his ability to follow the systems properly. As such, in order to find consistent success the trader must not only understand the steps of the system, but also practice the system frequently. Coupled with discipline and the right attitude towards risk, he will master these systems in no time and have good profits to show for it.


Comments (0 comment(s))