
9 Keys for Predicting Currency Movements
Successful trading in the Foreign exchange market is always heavily dependent upon the trader’s ability to identify good opportunities and make accurate predictions. This is usually achieved by conducting the technical or fundamental analysis. When it comes to the latter, it is helpful to point out that there is no single indicator or method which can always guarantee success. Instead, here we have several both short term and long term indicators,s which can certainly give some guidance to traders in a decision-making process.
In this article, we will focus on 9 key factors, which have a very notable influence on the exchange rate movements. This includes:
- Central Bank Interest Rate Decisions
- Central Bank Official Statements
- Inflationary Developments
- Employment Data
- Relative Real Interest Rates
- Fiscal Policy
- Trade Balance
- Central Bank Balance Sheet
- Purchasing Power Parity
Here it is essential to mention, that the very presence of those powerful forces, moving the market, does not mean that Forex movements will always be predictable. For many reasons, including geopolitical events, shifts in market expectations, investor sentiment, natural disaster, pandemics can disrupt normal trading patterns for some time. Consequently, some currencies can stay deep into the undervalued or overvalued territory for months or even years, however in most cases they eventually tend to return to their natural equilibrium, which is formed under the influence of the factors, discussed above. So let us now go through each of them in more detail.
Central Bank Interest Rate Decisions
The experienced Forex traders are aware of the fact that the central bank interest rate decision announcements are usually followed by a higher degree of market volatility. The reasoning behind this is quite simple. Everybody in the market is looking to earn some decent payouts by their activities. One way to achieve this is to use carry trading strategy, which essentially involves selling lower-yielding currencies and buying high-yielding currencies. As long as a trader keeps those positions open, he or she can earn interest, also known as swap or rollover, on a daily basis. So if a given central bank decides to hike rates, then its currency becomes more attractive to traders, since this enables them to earn higher returns from this trading strategy.
Central bank interest rates also play a key role in determining rates on bank savings accounts and certificates of deposit. Therefore, a high-yielding currency is more likely to attract depositors, since this gives them the opportunity to earn higher returns on their investments. Consequently, this increases the demand for the currency in question and by extension, is more likely to lead to its appreciation.
Obviously, the opposite is also true. When a central bank lowers the key interest rate, its currency becomes less attractive. When this happens, traders’ return on carry trades diminishes, while investors and savers, earn lower returns on savings accounts and certificates of deposit.
For all of these reasons, this type of announcement usually triggers a higher degree of volatility in the market. To illustrate this, we can take a look at this 5-minute USD/CAD chart, which shows the price action, before and after the interest rate decision:
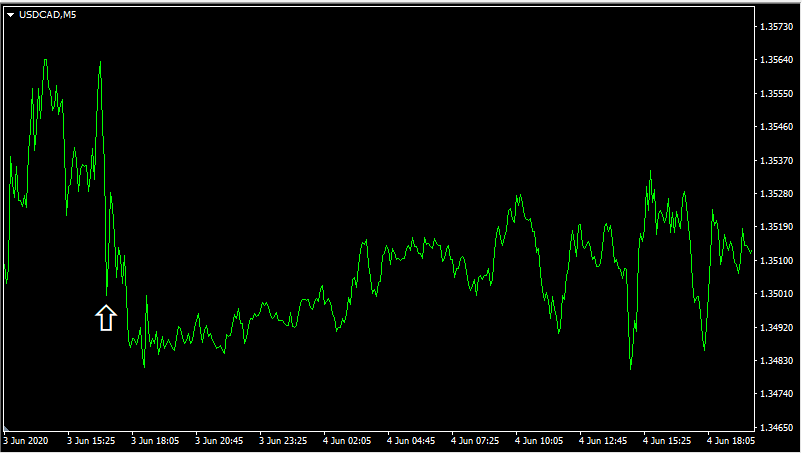
The bank of Canada kept the key interest rate unchanged, at 0.25%, which was essentially in line with the market expectations. As we can see from the chart, after the actual announcement came out, the USD/CAD rate fell from 1.3499 to 1.3480. However, after this development the exchange rate stabilized and slowly even gained some ground, eventually returning to 1.3512 level.
So as we can see from the above example, the fact that those announcements are accompanied by volatility, does not mean that the market always has to make a decisive move in one way or another. Just like in this case, the currency pair can move sideways and can eventually settle for the range which might be quite close to the original level. As we can see from the above, in this example, by the end of the period, covered by this chart, the USD/CAD exchange rate was only 13 pips higher compared to the time of the announcement.
One reason for this is the fact that the Bank of Canada made no changes in its policy and this was not surprising for the market participants and analysts either. Therefore, the scale of the volatility after the announcement was rather limited. On the other hand, in most cases, when the central banks raise or reduce rates, the market reaction is more profound and usually results in larger changes in the exchange rates in percentage terms.
Central Bank Official Statements
It is not only the actual key interest rate decisions that drive market volatility. Investors and traders also pay a decent amount of attention to the policy statements. Most central banks schedule their monetary policy meetings 8 0r 12 times per year. Even if the policymakers made no changes in interest rates, they still release an official statement. This includes a short summary of the latest developments in the economy and outlook of the foreseeable future. The market participants attach a great deal of importance to those statements since sometimes they might provide them with some clues about the future path of the monetary policy.
Some central banks, like the European Central Bank (ECB) also host a press conference after the monetary policy meeting, where after the initial statement, journalists have an opportunity to ask some questions. This process is also accompanied by an elevated degree of volatility. The reason for this is the fact that the initial statement by the chairmen and his or her responses to questions can help traders and investors to make some educated guesses about future monetary policy decisions. This is why the majority of rate cuts or rate hikes are already priced into the currency pairs before the actual announcement comes out. Market participants always try to predict those policy changes based on economic data, as well with official statements, issued by the central bank of the currency in question.
The actual degree of intervention by the central banker depends on the circumstances. Sometimes just the statement of intention can be just enough to achieve a desirable result and calm the markets. However, in some cases, the rate change can be the only forward for the central bank to reach its goals.
So this is why journalists and market participants pay a decent amount of attention to those central bank press conferences. It is always helpful to listen to the aims and comments of policymakers because at some point in the future they might decide to act on those statements and make the actual changes in the interest rates.
Inflationary Developments
Obviously, central bankers do not make their policy decisions randomly. All such major financial institutions have their officially stated aims, also known as ‘mandates’. Just to bring several examples, the US Federal Reserve aims at 2% annual inflation, and at full employment, the European Central Bank intends for the Harmonized Index of Consumer Prices (HICP) to be below, but close to 2%. The Bank of Canada’s mandate is to keep CPI within a 1% to 3% range. In a heavy majority of cases, the main goal of a central bank is to keep inflation at a certain target or within some specified range.
Consequently, traders and investors can significantly improve the quality of their analysis, if they take a look at how the current CPI rate of a given country deviates from the intended goal. Here it is important to mention, that all those central bank mandates look at the medium-term horizon. It is practically impossible to manage short term inflation in a way, which will always remain at 2%. Seasonal trends, commodity prices, economic and political events can have a major impact on the price levels. Consequently, it is unrealistic to expect from the central bank to step in and always ensure that CPI remains at exactly the intended target. Therefore, short term variation is very much natural phenomena.
Central bankers usually take action, when the deviation from the current inflation rate and the actual goal becomes very large and consequently, threatens the price stability. As we have discussed before, one of the stated aims of the US Federal Reserve is to keep inflation at 2%. This does not mean that if the latest measures show 2.1%, the policymakers will immediately start hiking dates and winding down their balance sheets. This may have several reasons:
- The actual difference between the rate of inflation and the indented goal is very small. If it was 3% or above, it might be more realistic to expect some response from the policymakers, however, the 1% difference is too small to warrant any major changes in the policy.
- Depending on the situation, the spike in the Consumer Price Index can be caused by temporary factors such as higher commodity prices. Cases such as oil or dairy products becoming more expensive. Instead of reacting to those immediately, many central bankers prefer to observe those developments and see whether those developments led to only temporary spike on CPI, or can lead to higher inflation for years to come.
- Other economic indicators might be very poor. If the growth rate of the Gross Domestic Product is very weak and the country faces high unemployment than hiking rates under this environment can only increase the mystery for the citizens and such overreaction could eventually lead to deflation.
Finally, It is also helpful to keep in mind that it is not only one individual Consumer Price Index report which is most important, but the overall direction of the inflationary trends. For example, the central bank might be more willing to hike rates if CPI rose steadily and stays above its intended over the months, rather than just one instance when it is higher than 2%.
Employment Data
Another major factor that can have a major impact on the decisions making the process of the central bank is the unemployment rate and other employment indicators. This is especially important when it comes to the US Federal Reserve. This institution has the so-called ‘dual mandate’ of maintaining price stability and full employment. The latter term does not imply a 0% unemployment rate since it is highly unrealistic. There will always be some people who do not have jobs, due to layoffs, or some other economic or personal reasons. Instead, some sources suggest that this term can be quantified as 5% unemployment since it is a more attainable and sustainable goal.
Therefore, just like changes in the inflation rate can influence the monetary policy, the latest variations in the unemployment rate have the potential to alter interest rate decisions of the US Federal Reserve. Actually, those two indicators are usually very closely tied together. If the jobless rate is low, then potentially more consumers will have enough money to spend on goods and services, which can eventually drive general price levels higher. On the other hand, if unemployment rises, more people might have a hard time making ends meet, so they are likely to consume much less than before. The collapsing demand will most likely drive the cost of goods and services lower, reducing the rate of inflation in the process.
For the sake of accuracy, it is vital to mention, that this is not always the case. There are economic scenarios, where those two indicators are not highly correlated to each other. One obvious example of this would be the rising prices of raw materials, like the price of oil, metals, or other goods. if this process persists, it will not only push inflation much higher but can also potentially increase the rate of unemployment. The reasons behind this are the fact, that since companies now have to spend more money on raw materials, they will have less money to spend on payrolls and can be eventually forced to lay off some portion of their staff. This is what economists call the ‘Cost-Push Inflation’.
Relative Real Interest Rates
The factors which affect the exchange rate movements are not strictly confined to the central bank decisions and indicator, which influence their decision-making process. One of the indicators which are not directly controlled by the policymakers is the relative real interest rates. This might sound like a complicated term, however, the essential idea behind this is quite simple.
Economists and investors make a distinction between the nominal and the real interest rates. The former terms denote the actual interest rate depositors receive on their savings accounts and CDs, or rates borrowers pay for their consumer loans, credit cards, auto loans, and inflation. The real interest rate takes inflation of the given currency into account. So this essentially measures how much return the lender is getting in terms of purchasing power.
For example, let us suppose that an individual lends money to the bank by opening the Certificate of Deposit for 1 year with A$10,000. The currency in question is the Australian dollar, the agreed nominal interest rate is 4% and annual inflation in Australia stands at 3%. So by the end of the year, once the term of this CD expires, the client will receive A$10,400. So in nominal terms, the individual will gain 4%. However, if the inflation stays unchanged at 3%, the real return on this investment will be 4% – 3% = 1%.
It is not surprising that real returns can play an important role in the decision-making process of investors. This makes sense since people are usually more concerned about the actual goods and services they can afford from their income, rather than its nominal amount. This is exactly the reason why the currencies with higher real yields tend to appreciate against its peers.
For one example of such a scenario, we can take a look at this daily AUD/CHF chart:
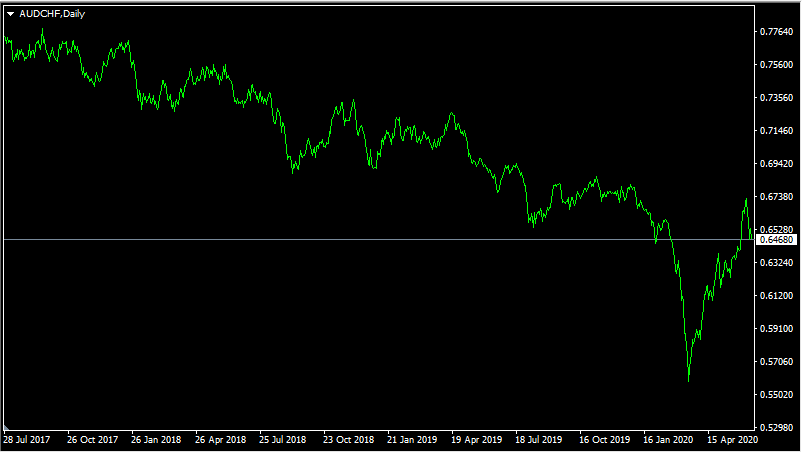
By 2017 the Reserve Bank of Australia kept its cash rate at 1.50%. However, from 2019 the Australian policymakers reduced the rates gradually to 0.25%. At the same time, the Swiss National Bank held its interest rate at a record low of -0.75%. So by 2017, the nominal interest rates in Australia were higher by 2.25%, compared to that of Switzerland.
The conventional wisdom would suggest that during this period the Australian dollar should have made massive headway against the Swiss Franc. However, as we can see from the above, what actually happened in the market was completely opposite. The AUD/CHF exchange rate decline steadily, falling from 0.76 from July 2017 to 0.56 by March 2020. After this selloff, the pair recovered and returned close to 0.65. However, as we can see from the chart it remains solidly in the downtrend.
So how can it happen that despite such large nominal interest rate differentials, Swiss Franc still made some significant gains against the Australian dollar? One of the most likely reasons for this might be the fact that in terms of the real interest rates the CHF has an upper hand. According to the Australian Bureau of Statistics, the average annual inflation in the country since 1993 stands at 2.5%.
In the case of Switzerland, the situation is quite different. The long term 25-year inflation average is below 0.5%. In fact, the price levels remained mostly flat since the 2008 great recession. So after taking this data into account, we can conclude that during 2017 the Australian real interest rates were at -1% when in the case of Switzerland they stood at -0.75%. However, here we need to keep in mind that the Swiss National Bank can not enforce negative interest rates for all of its clients. Many consumers can just withdraw their money to avoid those charges. Therefore, for those investors and savers, the real interest rate for CHF is 0%.
By 2020, the Bank of Australia reduced rates to 0.25%. This increased the real interest rate differentials in favor of the Swiss franc. In this case, the Australian interest rates stand at -2.25%, compared to Switzerland’s 0% to 0.75% rate. Obviously, CPI rates change constantly, however here we used the long term average for our analysis, in order to make it more simple and digestible.
So as we can see, everything else being equal, the currencies, which have higher real interest rates tend to appreciate against the one with lower real interest rates.
Fiscal Policy
When discussing the factor, influencing the exchange rates, many commentators do not discuss this component. In fact, there is a prevalent trend to say that the budget deficit does not really matter and does not play a meaningful role in the Forex market.
However, recent evidence contradicts this. The recent Eurozone sovereign debt crisis has demonstrated that for years, countries can run large amounts of the budget deficit and for some time it can have no adverse consequences for the economy. However, eventually, there comes the point when investors lose confidence in the government’s ability to repay its debt obligations, demanding higher interest rates on bonds.
The choice during the debt crisis is very clear: devalue the currency or implement some painful cuts in public spending. Longer the budget deficits get out of control, harder it becomes to restore the public finances in order, within doing massive damage to the economy. Therefore it is always helpful to keep an eye on the fiscal policies of major countries since at some point it can have a significant impact on the exchange rates.
One very obvious example of this is the Eurozone sovereign debt crisis. Luckily, so far the currency block overcame those difficulties and maintained its integrity. However, it did not come without paying a price. In Summer 2008, going into this crisis, EUR/USD stood at 1.59. By 2015 the pair dropped below 1.15 and even by 2020, the Euro can not decisively overcome this level. There was one instance when the single currency was able to get above 1.20, but it was rather short-lived, as the pair fell back on new ECB easying measures and the rate hikes of the Federal Reserve.
Obviously, at some point, it is possible for the Euro to return to its former strength. However, there is no doubt that the sovereign debt crisis did a lot of damage to the Eurozone economy and to its currency. It goes without saying, that those considerations are not strictly limited to the European currencies. All countries who lose control over their spending are very likely to face debt problems and currency devaluations at some point in the future.
Trade Balance
The trade balance can have a major impact on currency exchange rates. This indicator measures the difference between the total value of exports and imports in a given country. If a nation exports more than it imports than it is said that it is running a trade surplus. This can be beneficial for the currency in question in several ways.
Firstly, foreign companies and individuals have to convert their currencies to the local currency in order to purchase goods and services they need. This creates a natural demand for the currency in question and supports its exchange rates in the long term.
Secondly, net exports are one of the four components of the Gross Domestic Product (GDP). So in the case of the trade surplus, the differential between the total value of exports and imports is added to the GDP. Therefore, this helps the country to achieve a higher rate of economic growth, which usually strengthens the currency in question.
On the other hand, if a nation imports more than it exports than this is called a trade deficit. This has the effect of weakening economic growth and also supports currency depreciation. This does not mean that all countries with a trade deficit necessarily have weak currencies. There are many factors at play when it comes to exchanging rates. However, when it comes to currency strength, running a trade deficit is indeed a negative factor.
Central Bank Balance Sheet
The changes in the size of the central bank balance sheet are yet another factor that can have a notable impact on the Foreign exchange market. In the aftermath of the 2008 great recession, many central banks across the world faced a so-called ‘liquidity trap’ problem.
The meaning of this term is that since the policymakers reduced rates to 0.25% or to 0%, they just ‘run out of ammunition’. In response to low inflation and a weak economy, they could not just keep cutting rates to -3% or -5%. The commercial banks can not simply pass on those rates to customers. Instead of paying those charges, consumers will just withdraw the money and deposit it on the current accounts, where they do not have to pay those negative interest rates.
So instead of going down to this road, many central banks instead turned to so-called ‘Quantitative Easing (QE)’ programs buying up government bonds and some other assets and injecting extra money into the economy. In some cases, this can help to stimulate economic growth. However, the basic principle of supply and demand applies to this process as well.
As a result of the Quantitative Easing process, there is more money coming into the circulation. According to the basic economic rule, if the supply increases and demand stay the same, then the price drops. This means that when more dollars come into circulation after some time, each of them is worth less than before. So in essence, QE is an inflationary policy.
The actual duration and the amounts used in the Quantitative Easing program is announced and adjusted by the relevant central bank. Consequently, if the economic conditions improve, the central bank is more likely to reduce the size of monthly asset purchases or terminate QE entirely. Obviously, the latter scenario can have as much of a positive impact on the currency as an actual rate hike. So this can be something useful to keep in mind, during a decision-making process in trading.
Purchasing Power Parity
Finally, we have a Purchasing Power Parity (PPP). This indicator measures the exchange rate at which the average prices of goods and services in two given countries will be equalized. This is measured by several organizations, including the Organization for Economic Development and Cooperation (OECD).
Since 1986 the British financial magazine the ‘Economist’ regularly publishes the so-called ‘Big Mac Index’. This indicator tracks the average prices of this McDonald’s product in dozens of countries. In a way, the Big Mac Index does represent a well-diversified basket of goods and services. It includes the cost of bread, cheese, cucumber, lettuce, beef, sesame seeds, transportation, labor, rent, and taxes. Obviously, there is no such thing as a perfect basket of goods and services to produce 100% accurate results, but this indicator can give us some idea about the Purchasing Power dynamics between the currencies.
To illustrate this we can take a look at this long term EUR/USD Purchasing Power Parity Chart:

As we can see from this chart in terms of the Purchasing Power Parity, the EUR/USD pair has gone through 2 stages. By 1990 the PPP rate stood at 1.00. As we can see from this chart, the degree of fluctuation was significant, however, from 1990 to 2002 overall the US dollar experienced less inflation compared to its counterpart and as a result, the Purchasing Power Parity level of EUR/USD fell to 0.93.
However, from this point onwards, it was the Eurozone which experienced lower inflation, compared to the US. As a result, the PPP level of the Euro/Dollar has risen steadily over the years, reaching 1.38 by 2020. This shift is evident in the exchange rates as well. Back in 2000, at the hight of US dollar strength EUR/USD dropped to 0.83. After 2 decades during its strongest performance, USD only managed to get to 1.04, approaching parity level, but not being able to overcome it. So here once more we can see that Purchasing Power Parity can have significant long term influence on the Forex market.
Predicting Foreign Exchange Market – Kay Takeaways

- When it comes to the Fundamental Analysis there is not one method, which can guarantee success. Instead, there are at least 9 factors which can have a significant influence on the exchange rates. This includes central bank interest rate decisions, their statements, factors which affect those policies, as well as other long term indicators such as relative real interest rates and Purchasing Power Parity (PPP).
- Basing the fundamental analysis only on nominal interest rates can be very misleading. Instead, using relative real interest rates for this purpose can be more reliable. The reason is that this latter indicator takes inflationary dynamics into account. This is crucial since investors are more interested in buying power of their income, rather than its nominal amount.
- Currencies can stay on overvalued or undervalued territory for months or even years. However, they eventually tend to return back to the Purchasing Power Parity (PPP) level. Over a long period of time, the inflation differentials can significantly shift the PPP level in favor of one of the currencies in a given currency pair.


Comments (0 comment(s))