
What are GDP Types and How Traders Can Use Them?
The Gross Domestic Product (GDP) is indeed one of the most important measures of the economic performance of the given nation. This indicator measures the total value of all goods and services, produced in a country within a specific quarter or a year.
The GDP has four main components. Firstly, it includes consumption, which includes all household spending. The second component is an investment, which represents the capital expenditures by businesses. The third element for this formula is government spending, including all expenditures by the public sector. The fourth and final component is represented by net exports, representing the balance between imported and exported goods and services.
There are several different measures of the Gross Domestic Product. Nominal GDP measures the country’s economy in raw dollar numbers, without any inflation or population adjustments. The Real GDP has a very similar calculation methodology, with the difference that it takes into account the inflationary dynamics of a given country. Finally, we have a GDP per Capita, as the name suggests, this measure divides the Gross Domestic Product on the population of the nation. This indicator is also used to come up with some estimates of living standards in a given country.
The release of the latest GDP reports usually triggers a period of higher volatility in the Forex market. Central banks across the globe typically target a specific level of Inflation, rather than any particular rate of economic growth. However, those policymakers still take GDP dynamics into account, since it represents one of the most important measures of the overall health of the economy.
GDP Formula
The basic formula of the Gross Domestic Product is quite simple. It is expressed as: Y = C + I + G + NX. Here those letters have the following meanings:
- Y – Gross Domestic Product
- C – Consumption
- I – Investment
- G – Government Spending
- NX – Net Exports
Obviously, each country has its own specific composition of GDP, with some countries one particular component making up a larger part of the economy than with the others. So next obvious question is: what is the structure of the US Gross Domestic Product? To answer this question, let us take a look at the composition of the US GDP in 2019:

As we can see from the chart above, Consumption is the largest component of the GDP not just in the case of the United States, but also with the majority of the world’s economies. During 2019 in the US it was at $14,795 billion. This represents roughly 2/3 of the entire GDP.
The second-largest component of US Gross Domestic Product is represented by the Government Spending category, which was at $3,814 billion. This is followed by the Investment component, which equaled $3,698 back in 2019. The smallest component here was the net exports category. Since the balance was negative, it reduced the overall GDP by $578 billion.
Now for the purpose of getting more clarity, let us go through each of those categories in more detail, to find out how they are measured and what influences those components.
Consumption
Consumption is the largest component of the Gross Domestic Product for most countries around the globe. This category includes all household expenditures. Consumer spending on goods and services such as healthcare, food, shelter, clothing, furniture, cars, and other items are all included in this component.
In the case of most developed countries, this component makes up more than half of the GDP. Therefore, even a relatively small change in consumer spending can have a significant impact on the economic growth rate.
GDP reports are typically published one or two months after the relevant period, depending on the country. Consequently, many professional traders and investors do make use of the forward-looking indicators to observe the latest changes in consumer behavior and by extension, predict future economic growth rates. For example, retail sales numbers are published much sooner than GDP reports and it shows the latest dynamics with a significant portion of the household spending.
For example, during March, the US retails sales showed a decline of -5.68% compared to the previous year. The next report was published on May 15, 2020, here it turned out that it fell by -21.61% compared to the spending levels of April 2019. It goes without saying that this was a very bad sign for US economic growth. Sure enough, when the first-quarter GDP numbers came out, it confirmed a -5.0% decline in the economy. So if an individual takes a look at the latest reports for this indicator, he or she might get some idea about the recent developments with the Gross Domestic Product of a given country.
Another handy measure, which has a great effect on the Consumption component of GDP is the Consumer Confidence Index (CCI). This measure is constructed using the survey results of thousands of households, interviewing them about the past and future employment and business conditions, as well as family income. It also has quite an impressive predictive power, since both 2001 and 2008 recessions were both proceeded by the dramatic fall in the consumer confidence numbers. So both retail sales and CCI reports can give investors and traders some early clues about the likely future path of the GDP growth rate, which is always helpful for Forex trading.
Investment
The second component of the Gross Domestic Product is Investment. This might be somewhat confusing since many activities are referred by the same name. To clear out the confusion, it is helpful to mention that this category only includes business investment. Under normal circumstances, nearly all business leaders are looking forward to expanding their activities. To achieve this businesses spend significant sums on such items as new equipment for the personal, machinery, updated software, stationery items, and many others.
Many economists and financial experts are of the opinion, that the economic growth generated from increased investment is preferable to this being achieved by rising consumption. Their positions are based on three arguments:
- Rising capital spending by businesses can certainly improve labor productivity levels. This can lead to a higher rate of economic growth, typically accompanied by reduced inflation. On the other hand, the GDP expansion led by increasing consumption usually results in rising price levels. Consequently, constantly expanding investment components can certainly improve the living standards of the country’s population in the long term.
- Very often when businesses by new machinery or other types of equipment, they hire more people to operate them. As a result, this process can help to create more jobs and consequently, reduce unemployment levels in a given country.
- Investment is a relatively less volatile component of GDP, compared to consumption. The latter fluctuates quite a lot since it is driven by individual needs, emotions, and desires. When in the case of the business investment, those decisions are typically made with analysis and long term planning. Consequently, gains made in this category are relatively more sustainable, than compared to the consumption category.
Due to those reasons, many governments across the world, realizing the benefits of business investment do implement policies to give businesses incentives to increase their capital spending and grow their companies in the process.
Government Spending
Government spending is the second-largest component of the US Gross Domestic Product. This includes the expenditures on military, welfare, education, healthcare, infrastructure, as well as salaries of the public employees.
In modern capitalist economies, this is the only component that is directly controlled by the government. During the ties of an economic downturn, the consumption and investment components of GDP typically tend to fall notably. The reason behind this is that faced with financial concerns and uncertainty about the future, many households and business leaders decided to cut their expenditures and save more money for possible rainy days.
So this is the point when very often governments tend to step in, raise their spending to offset some of the losses to the economy. As a result, the scale of recession might not be as severe as it would have been without any intervention. Ideally, once the economy recovers and back to growth, then the government can reduce its expenditures to normal levels.
However, in all fairness, it must be mentioned that those policies do have their limits. If there is a decline in the economic activity the government can not just throw an unlimited amount of money at the problem. Out of control, public spending can have serious repercussions for the economy in the long term. The exact nature of those future problems depends on the source of those extra funds, which the government spends on top of its revenues.
One very common way to finance the deficit spending is to borrow money. Governments do this by issuing interest-bearing bonds, maturities of which can range from just 1 week to going as long as 30 years. However, if the government loses control of its spending, then sooner or later, at some point investors might suspect that they might never get back their investment. As a result bond yields can rise and the country in question can no longer service its debts. This essentially how the sovereign debt crisis developed in the Eurozone.
Another option is to monetize the debt. When talking about the subject of money printing many people remember Weimar Germany and its hyperinflation. However, it does not have to go that way. If the government limits the amount of money-creation than it can devalue the currency by certain percentages, instead of repeating those extreme scenarios. Still, this policy has a negative effect of reducing the purchasing power of savings and incomes of the country’s citizens and depreciation of the currency against its peers in the Forex market.
So the government intervention during the times of economic downturn can certainly help the economy to recover faster. However, it does have its limits and in some cases potential downsides as well.
Net Exports
The final component of GDP is the Net Exports category. This component is calculated by subtracting the total number of imports from the total number of exports of a given country. In the case of the majority of nations, this is the smallest category.
However, this component can still have a notable impact on exchange rates. For example, if a given country runs a trade surplus, it means that it exports more goods and services abroad, compared to its imports. In order for the foreigner individuals and businesses to purchase those, they first have to convert their amounts to the local currency. Only after this process, they will be able to buy their desired products and import them. This creates a natural demand for the local currency, with the additional benefit of adding some amounts to GDP.
On the other hand, in the long term, the large trade deficit can act as a drag on the currency in question. In addition, it does not help the economy that the difference between exports and imports is subtracted from the Gross Domestic Product of the country.
There is a still debate going on among economists and financial experts, whether a strong currency would hurt exports and can be damaging for economic growth as a whole. This assumption has the following reasoning: the appreciation of the currency makes the country’s exports more expensive, with foreign individuals and companies having to pay higher amounts to access the local goods and services. At the same time, stronger currency makes imports much cheaper for the residents of the country, so it is highly likely they will import more items from abroad. As a result of that development, the nation’s trade balance worsens, which has a negative effect on the GDP of the country.
Now, in theory, this might indeed seem like a very solid argument, but is it supported by the evidence? Well, we have already discussed the structure of the Swiss economy, so let us return to that example. CHF made significant long term against the most major currencies in the Forex market. At the beginning of 2020, the USD/CHF pair was trading at 1.60, while EUR/CHF exchange rate stood at 1.61. After more than 20 years, in June 2020, 1 USD only buys around 0.95 Swiss Francs, while at the same time with 1 EUR, an individual can purchase approximately 1.08 CHF. This means that during the last two decades, the Swiss currency has appreciated by 68% against the US dollar and gained 49% against the Euro.
Therefore, according to the theory, mentioned above the Swiss exports should have fallen dramatically and the country’s GDP should have been negatively affected by the rising trader deficit. Is that so? Well, actually, it is quite the opposite. Back in 2000, the trade surplus made up only around 6.1% of the Swiss GDP, however by 2018 this proportion has exceeded 12%.
So here we can see that strengthening currency does have its benefits and does not necessarily always translate into the weakening economy. The very fact that importing raw materials from abroad becomes cheaper is just one upside of having an appreciating currency.
Real GDP and GDP per Capita
The nominal GDP can be a very useful measure for the economic performance of the country. However, it does have at least two major downsides. The first issue is the fact that this indicator does not account for the changes in the price levels. As a result, the Real GDP was designed to address those concerns.
For example, let us suppose the Gross Domestic Product of one country for the year 2020 was $10.5 trillion, compared to $10 trillion back in 2019. During the same period, the annual inflation rate was 3%. This means that the growth rate of nominal GDP was 5%, which seems quite a decent amount of economic growth. However, focusing on this one indicator alone can be very misleading. If we move on to the Real GDP, we have to subtract inflation from the overall number. This is also known as the ‘Deflator’. So in this case the growth rate of the Real GDP would be 2%, which is obviously much better than a recession, but clearly not as impressive as 5%.
The second problem with the nominal GDP is the fact that it does not take the population factor into account. As a result, it is not a very useful measure for the living standards in a given country. To address those problems, there is a GDP per capita indicator. It essentially divides the Gross Domestic Product on the number of population of a given country.
So for example, in 2018 China had a nominal GDP of $13,610 billion, compared to Switzerland’s $705 billion. It is clear that this Asian country has a much larger economy. However, without further analysis, it is impossible to say how those two countries’ living standards compare to each other. So if we check GDP per capita figures from 2018, we will see that this number in China is $9,771, while in the case of Switzerland this indicator stands at $82,797.
It might be surprising, measuring by GDP per capita figures, Switzerland’s livings standards might be around 8.5 times higher than China, despite having more than 19 times smaller economy in terms of nominal GDP.
Composition of GDP
As we have seen from the diagram of GDP components of the United States, the consumption makes up 2/3 of the the the Gross Domestic product, with the Investment and Government Spending being far behind and represented by very similar amounts. Finally, the negative net exports reduce the overall GDP by roughly 5%.
There are many developed countries in the world, which have very similar compositions. However, this is not necessarily the case with every single nation. In fact, Switzerland’s GDP composition is radically different from that of the United States.
Here the consumption is still the largest component, but it only makes up 53.7% of GDP, more than 14% lower than in the case of the US. One large difference between those two countries is that the Investment component in the case of Switzerland makes up 23.1% of GDP, which is notably higher than in the US. Next, the Swiss Government Spending category accounts for 12% of the Gross Domestic Product.
Another very notable difference between those two nations is the fact that Switzerland is running a solid trade surplus, essentially adding 11.1% to the GDP of the country, this is in sharp contrast to the significant level of the trade deficit in case of the US economy. So all countries in the world have their own unique GDP composition with all of its benefits and vulnerabilities.
Trading GDP Announcements
Now that we have discussed all components and types of GDP the next obvious question is how to use this knowledge during the Forex trading. Here there are two subjects a trader or an investor has to analyze when working with GDP numbers:
- Firstly, the trader must be able to answer the questions: how does the latest GDP release compares to that of the previous period? Is the rate of growth of GDP rising, with the economy getting stronger, or it is falling?
- Secondly, the trade must analyze how the latest GDP release compares to the analyst consensus. Is it in line with expectations? Or has it exceeded or missed those forecasts?
So, if the GDP growth rate is improving and is in line or above the expectations, this can be a bullish sign for the currency in question. Then a market participant might decide to buy that particular currency.
The opposite is also true. If the GDP growth rate is declining and the latest release misses the analysts’ forecasts than this can be interpreted as a bearish sign. As a result, the trader might consider selling the currency in question.
Moving on to some practical real-life examples, here, on this 5-minute EUR/USD chart, we can take a look at price action before and after the Eurozone GDP announcement:
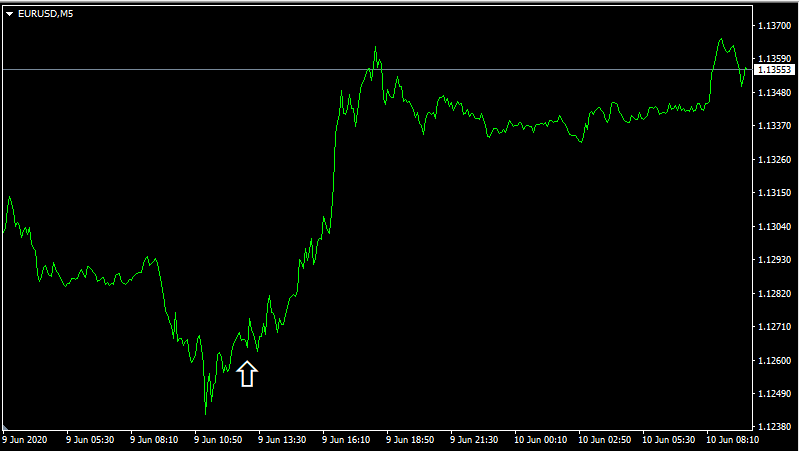
This report came on June 9, 2020. Previously the GDP growth rate was at -3.2% and according to the analyst consensus, it was forecasted to stay unchanged. However, the actual number turned out to be at -3.1%. Now, this might not seem much different, however, it still exceeded the market expectation and put some limit on the scale of the economic decline in the region.
As we can see from this chart, the Euro made some significant gains after this announcement. The single currency has risen from $1.1265 to $1.1368. This means that in less than 24 hours the EUR/USD gained more than 100 pips. So this suggests that GDP announcements can have not only the long term but also a notable short term impact on the currency exchange rates.
We can also take another example, from this 5-minute USD/CHF chart, where we can see the market response before and after the release of US GDP numbers:
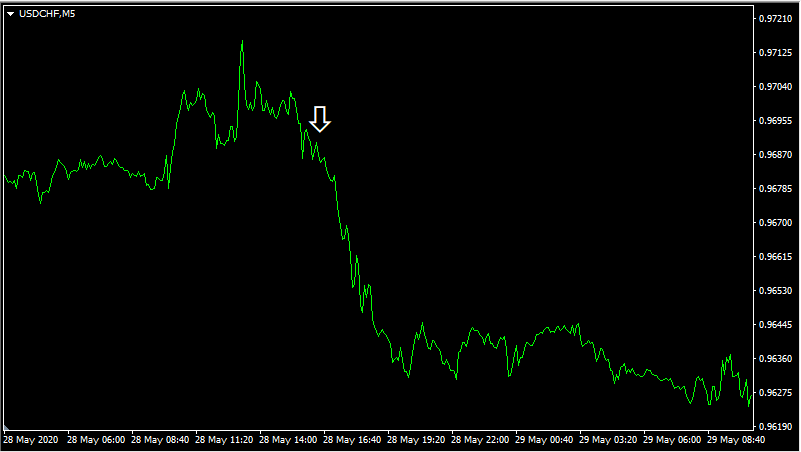
The report was published on May 28, 2020. During the previous quarter, the GDP growth was at 2.1%, however, the analyst consensus for the first three months of the year was at -4.8%. Surprisingly, when the actual numbers came out it turned out to be even worse than those pessimistic forecasts. According to the report, the US economy has contracted by 5% during this period.
The market reaction to this announcement was swift and decisive. As we can see from the chart above, the USD/CHF exchange rate fell sharply during the rest of the trading session, falling from 0.9690 to 0.9626 in a relatively short period of time.
So we can conclude that unlike with the central bank interest rate decisions, the market reaction to GDP announcements is relatively more predictable. The reason behind this is the fact that traders always try to predict the outcome of those monetary policy meetings beforehand. This is not a very easy task, however, using the latest Consumer Price Index numbers and other economic indicators it is quite achievable.
However, unless one has some valuable insider knowledge, it is difficult to predict the exact numbers from the GDP report and say beforehand with some level of certainty, whether those figures will miss or exceed the market expectations. Consequently, GDP announcements are typically not priced into the currency pair, before the actual publication. Therefore, it is relatively easier to trade Gross Domestic Product news releases, compared to central bank interest rate decisions.
Understanding GDP – Key Takeaways

- The GDP formula consists of four components: Consumption, Investment, Government Spending, and Net Exports. Any changes in any of those categories can have a major impact on the overall rate of economic growth. This indicator has a significant impact on the monetary policy as well. Central banks typically do not target any specific annual GDP growth rate, however, their board members still take the latest developments in this area into their decision-making process.
- Consumption is the largest component of the Gross Domestic Product. In the case of the United States, it makes up at least 2/3 of the GDP. Consequently, indicators such as retail sales and Consumer Confidence Index (CCI) can provide investors and traders with early clues about the future direction of the GDP of the given country. Consequently, those measures can have a significant impact on exchange rates.
- There are some items in the Forex economic calendar which are usually priced in before their actual announcement, one obvious example of this would be the interest rate decisions. However, GDP reports are not in that category, since it is very difficult to estimate the growth rate of the economy beforehand. As a result, the market reaction is very often quite predictable in the aftermath of those publications. Therefore, it is usually relatively easier to trade GDP announcements, compared to the central bank interest rate decisions.


Comments (0 comment(s))