
What is Currency Correlation and How to Trade It?
Many experienced traders and financial commentators mention the currency correlation. For beginners, this might sound rather a complicated term. However, the main idea behind this very simple. The positive correlation takes place when two currencies or securities tend to move in the same direction.
For example, Australia is one of the largest Gold producers in the world. In 2019 the country’s gold mining reached an all-time high of 325 tonnes a year. Consequently, when the price of this precious metal rises, this can benefit the Australian economy substantially. The reason behind this is that when Gold becomes more expensive, the Australian mining companies can increase their revenues substantially. This gives them opportunities to raise wages and create more jobs. Finally, as a result of rising profits, those firms pay more in taxes to the Australian government.
Consequently, for many years, AUD/USD and XAU/USD (Gold Price) were positively correlated. This means that most of the time, they move in the same direction.
However, we also have cases of negative correlation. So this applies to securities, where just the opposite is the case. So when currencies are negatively correlated, they tend to move in opposite directions. One obvious example of this is USD/CAD and oil prices. Here it helps to keep in mind, that Canada is the world’s one of the largest oil producers. Just like in the previous case, if the price of this commodity rises, then this can translate into higher revenues of Canadian firms, which operate in this industry. The local government can also benefit from higher tax revenues, which enables them to increase public spending without taking on more debt.
Finally, there are cases when some correlated currencies start to diverge for various economic reasons. So at some point, they may no longer move in the same direction. So the existence of past patterns does not always mean that this will always persist in the future.
Basics of Currency Correlation
Now that we have discussed its definition, the next obvious question is: how does Currency correlation work in practice? For the purpose of a better illustration let us take a look at this daily GBP/USD chart:
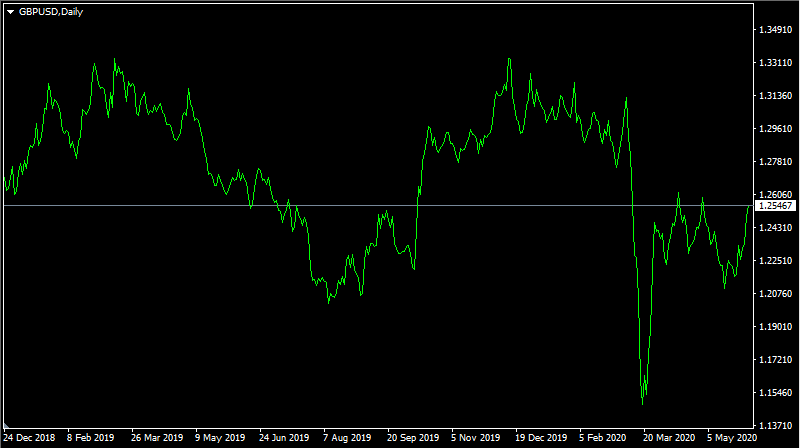
As we can see from the diagram above, the exchange rate has basically gone through several stages. Firstly, from late December 2018 to March 2019 the pound made some steady gains, eventually surpassing $1.33 level by the end of this period. Despite this development, the British currency started to decline during the subsequent months eventually dropping down to near $1.20 mark in August 2019. This was followed by a steady recovery, where the pair returned back to $1.33 level before the end of the year.
After two months of relative stagnation, the GBP fell sharply, as the COVID-19 concerns started to dominate the market. The rate of collapse was very fast indeed. Just in a matter of 10 days GBP/USD dropped down to $1.15. Finally, during the subsequent months, the pound regained some of its losses and nowadays trades just above to $1.25 level.
Now let us compare this diagram to the daily GBP/USD chart:
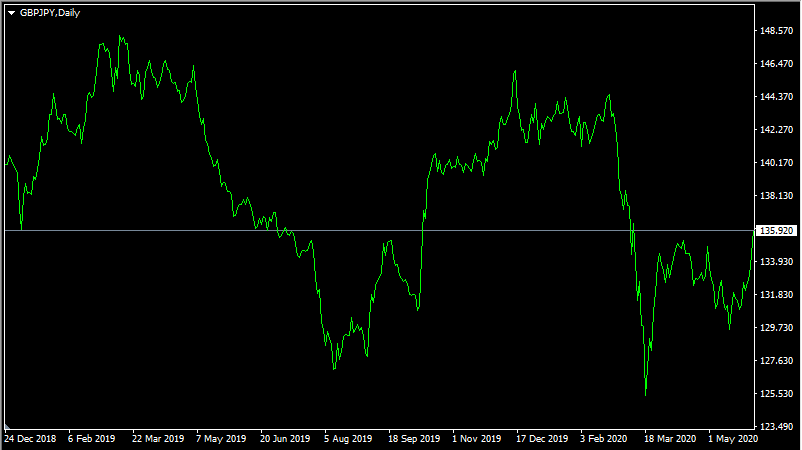
As we can see from this image, the price action of GBP/JPY was very similar to that of GBP/USD. Just like in the previous case, the pair had two pairs of uptrends and downtrends. This all ended with a very sharp decline in March 2020 and subsequent correction, where pound did regain most of its losses, but still trades well below of February level. So we can say that those two pairs are positively correlated.
Negatively Correlated Currency Pairs
As we discussed before, there are also plenty of cases of negative correlation among the currency pairs. To illustrate this let us take a look at this EUR/GBP chart and then compare it to two previous diagrams:
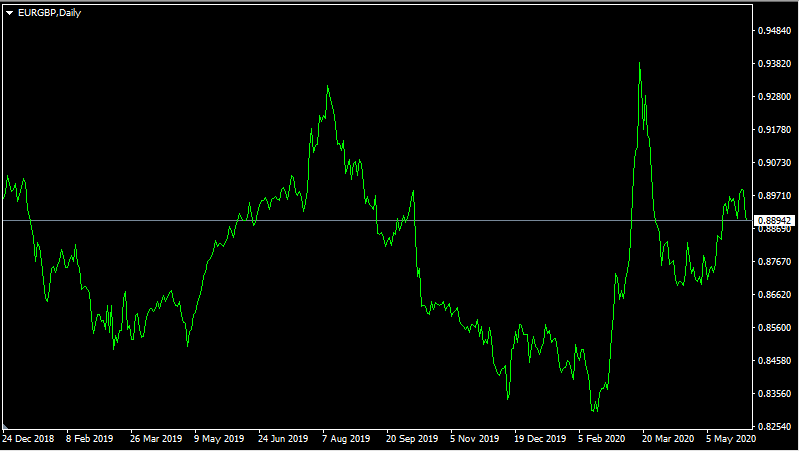
As we can see from this image, what happened to EUR/GBP was quite the opposite of GBP/USD and GBP/JPY. The pair declined during the first four months of 2019, falling from 0.90 to 0.85 level. During the next three months, the Euro regained all of its recent losses and even reached a peak at 0.93 marks. This was followed by a rather lengthy downtrend. Most of the time the price fell gradually, eventually reaching its bottom at 0.83 level.
The tide turned in the middle of February when Euro made some impressive and rapid gains against the pound. The previous downtrend lasted for 7 months, However, all it took was just one month for the single currency to reverse all of its losses and even reach new highs for the year. Finally, during the subsequent months of trading, the EUR/GBP pair stabilized, and nowadays trade close to 0.89 level.
So what we can see here is like a near-complete reversal of what happened in two previous diagrams. Consequently, after those analyses, we can say with some confidence that EUR/GBP is negatively correlated with GBP/USD and GBP/JPY. This makes sense since GBP is part of all three currency pairs.
However, any given two pairs do not necessarily have to have the same currency as a component in order to be positively or negatively correlated. This can happen with two completely different sets of securities. As we have seen from the introduction, there are also cases when one or several current pairs have a strong correlation with the price of one commodity.
Degrees of Correlation
Before moving on to other uses of this phenomenon, it is important to mention that not all securities are correlated to the same degree. This is why the correlation is measured by the coefficient. This number can range from -1.00 to 1.00. So if the indicator is at 0, it means that two currency pairs in questions are not correlated at all. 1.00 and -1.00 denote the perfect positive and perfect negative correlation respectively. Although in real life, those extremes are virtually non-existent. Even the most closely correlated currency pairs have this indicator at 0.90, 0.95, or even 0.99, but not 1.00.
This is simply because if GBP/USD rises by 3%, this does not mean that GBP/JPY has to climb by exactly the same percentages. There might be plenty of reasons why the pound could gain more against the Japanese yen compared to the US dollar and vice versa.
This means that if two given currency pairs have a positive correlation of 0.1, they are not really useful for any analysis. So the experienced traders are typically looking for highly correlated securities, for those which have coefficients at least at 0.6 or -0.6. For example according to the investing.com website, the correlation coefficient of 0.76. This suggests that those two securities mostly move in towards the same direction.
On the other hand, the correlation indicator between USD/JPY and gold price is -0.45. This does mean that those two securities sometimes move in opposite directions. However, the degree of negative correlation is not that strong. Consequently, it might not be the best idea to rely on this relationship between those two securities during the trading.
How to Use Currency Correlation During Trading
After going through the definitions and measurements of positive and negative correlations, the next obvious step is to explore its uses. So essentially this has its uses: Traders can utilize highly correlated pairs for finding more profitable opportunities as well as for constructing a viable hedging strategy as well.
The first method involves a combination of fundamental and technical analysis. For example, let us suppose that traders are considering to open some position on EUR/USD. However, the problem is that they can not find any viable technical entry signals. Then lt us further suppose that some positive inflation data pushed the Euro higher.
Since traders can not find reasonable entry points on EUR/USD, they can instead turn to other currency pairs which are highly correlated with this security. For example, market participants can analyze EUR/GBP. EUR/CAD or EUR/AUD. Since all of those are closely connected to the EUR/USD, all of them can benefit from the strength of the single currency. Consequently, traders might find much better entry points in the case of EUR/CAD or any other pair, which has a high degree of correlation with EUR/USD.
Here also market participants are not limited to just one security if there are favorable technical indicators, they can open 2, 3, or more positions with different currency pairs.
Traders can also utilize highly negatively correlated currencies for this purpose. EUR/USD and USD/JPY pair are just one example in this scenario. So if a particular economic event leads to Dollar’s appreciation against the Euro, traders might also look for entry points to open a long position on USD/JPY.
Currency Correlation in Hedging Strategies
There is also the second method to incorporate the currency correlation into trading strategies. So how this can work? Well actually, it is very simple. Returning to our previous examples, a trade can open a long GBP/USD position and at the same time take short GBP/JPY position. This means that the possible profits in one case will offset the losses of the other. Now here some people might wonder what is the point of making those two trades if they basically cancel each other out?
Well, here it might be helpful to mention that the trader is not obligated to close both of those positions at once. For example, if a long GBP/USD position turned out to be profitable and at the same time trader losses ground on short GBP/JPY position, then he or she can liquidate the second trade to cut losses and keep the first one open for a while.
From this point, there are two possibilities. If suddenly the market changes its direction than trade can simply close the second position as well, neutralizing the loss of funds from the first trade.
On the other hand, if this trend persists, then a market participant can close this position and earn profits which are much higher than the losses in the case of GBP/JPY. So the bottom line here is that in each case, a trader is protecting his or her account and in some cases has an opportunity to earn some decent payouts as well.
Finally, here it is essential to point out that despite all of the uses of this strategy, no Forex trading method can guarantee a 100% success rate. The market can be sometimes very unpredictable. Because of some important economic announcements or for any other reason, the typical patterns and relationships between currency pairs can change significantly.
Currency Correlation in Risk Management
The awareness of currency correlation factor can also help trades with risk management. Unfortunately, there can be cases where traders magnify their risk without even realizing it. For example, as we discussed above usually the price of Oil and the Canadian dollar pairs are usually closely correlated with each other.
So let us suppose that a trader opens three positions: buys Crude Oil, CAD/JPY, and sells USD/CAD currency pair. In addition, a market participant only puts 5% of his or her trading capital towards each of those trades. Now, at first sight, some people might conclude that it is a well-diversified training portfolio with good risk management.
However, if we analyze this further, this might not be the case. Here essentially, the trader takes the same side of the trade with the position. So if the price of oil goes up, then this most likely will also strengthen the Canadian dollar, with CAD/JPY rate rising and USD/CAD fall as a consequence. So if things turn out like that, then everything is fine with the trader’s trading account. Most likely he or she will end up with the winning position and earn some decent payouts in the process.
Yet, what happens if the market goes in the opposite direction? If the oil price falls than this can have very negative implications for the Canadian dollar. As a result, CAD/JPY will likely lose some ground and USD/CAD can appreciate as well. So the trader can suffer losses on all 3 of these positions. Also instead of risking just 5% of the trading account, the market participant has essentially risked 15% of his or her available funds for basically the same side of the trade. So this is something to be aware of during the trading process.
The proper risk management also includes taking into account those currency pairs which are negatively correlated as well. In this case, opening one long and one short position has the same effect as in the example described above. The trader is still on the same side of the trade and risks losing a significant portion of his or her trading balance.
Earning Interest from Commodities
There are many investors who are interested in investing in commodities and benefit from their potential price appreciation. However, there is one big downside to those investments. So if an individual purchases physical gold, oil or buy their ETFs, they can not earn a regular income from those assets. The only way they can earn some money is to sell those at higher prices, something which is not always possible and can be quite inconvenient. Those commodities simply do not pay any interest or dividends.
Luckily there is one viable alternative to this: investing in commodity currencies instead. For example, during many years, the Australian dollar was an attractive high yield alternative for this investment. So some of those market participants instead bought the Australian government bonds or alternatively opened certificates of deposit in AUD. As a result, those individuals could earn some return on their investments and also benefit from the rise of the gold prices as well.
The same principle applies to Oil. The price of this fuel has a significant impact on the Canadian economy and its currency. Consequently, it can be much more convenient for investors to purchase local bonds or other interest-bearing investments. As a result, if the oil prices go up, then those market participants could benefit from appreciating CAD and earn some income in the process as well.
Cases of Divergence
In many cases, the high degree of positive or negative correlation relationship between two different securities can go on for many years. However, this does not mean that those patterns are always necessarily permanent. Some major changes in the economic, financial, and other factors can later those relationships to a significant degree.
As mentioned before, for years the exchange rates of the Australian dollar followed the gold price closely. However, during the last 2 years, the paths of XAU/USD and AUD/USD diverged notably. To illustrate this, let us take a look at two diagrams.
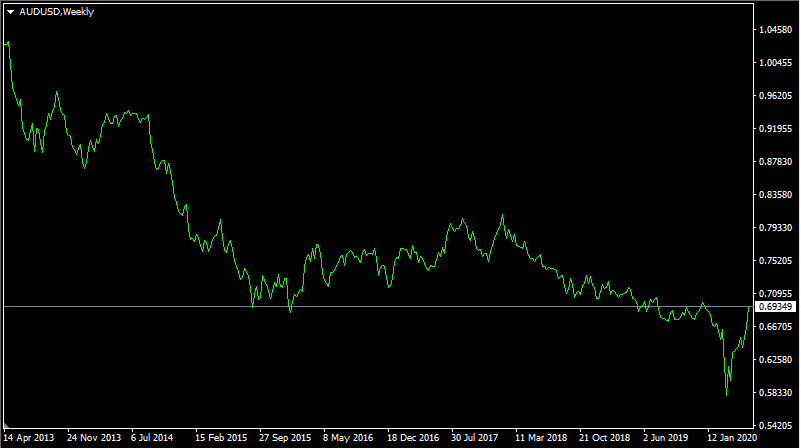
The first image represents the weekly AUD/USD chart:
The second image shows a weekly Gold price chart:
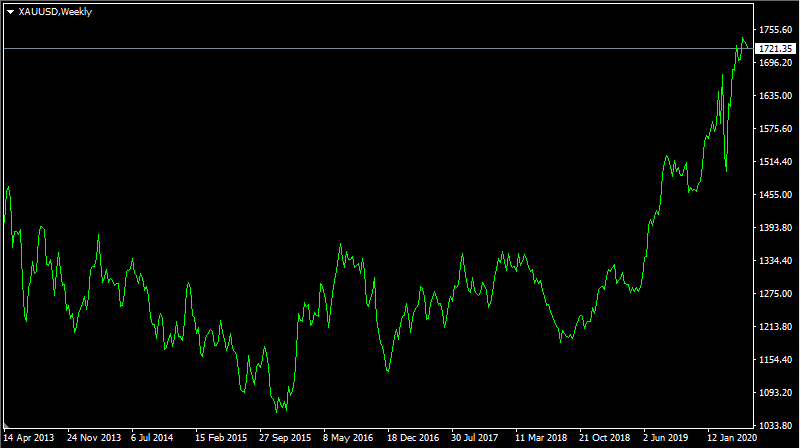
As we can see from those two images, from 2013 to 2015 both gold prices and AUD/USD declined substantially. Following this period, the price of both of those securities stabilized and mostly moved sideways for the next 3 years. So, clearly from 2013 to 2018 XAU/USD and AUD/USD were moving in the same direction.
However, after this development two securities diverged sensationally. From this point the price of this precious metal has risen steadily, even eventually surpassing the $1,700 mark. On the other hand, the Australian dollar has suffered from persistent depreciation. It was not long ago, when the AUD breached parity with USD, however even nowadays trade close to 0.69 level against the US dollar.
So what is the reason behind this dynamic? Logically, rising gold prices should have helped the Australian economy and by extension benefit its currency. Here essentially a different factor came into play.
As mentioned before, for years the Australian dollar was generally a high yielding major currency, even after the 2008 great recession. When the heavy majority of central banks adopted near-zero interest rates, Australian policymakers still kept rates at attractive levels.
However, since 2015 the Reserve Bank of Australia has cut its cash rate repeatedly. By 2020, it is already down to 0.25%. So those rate cuts made AUD much lower-yielding currency and consequently less attractive for investors. So this is the most important reason, why the Australian dollar kept falling, regardless of the rising gold prices.
Obviously one can not rule out the fact that if in the future the economy in Australia improves, then the RBA might start once more hiking interest rate. As a result, at some point, the high correlation between AUD and Gold prices can be restored.
Understanding Currency Correlation – Key Takeaways
- Positive currency correlation exists between different currencies or securities in general, when they tend to move in the same direction. The opposite is true in the case of the negative currency correlation. Not all currencies are correlated by the same degree. To measure this the trades use the so-called ‘correlation coefficient’. The actual number can range from -1.00 to 1.00. Here 1.00 represents the case of perfect correlation, while -1.00 denotes the perfect opposite correlation. Usually, such extremes are non-existent in the market. Nearly all highly correlated currency pairs have their coefficient between 0.60 to 0.99.
- Trades can utilize highly correlated currencies not only for improving their risk management but also for hedging purposes as well. For example, market participants can avoid opening long positions for two pairs with a high level of positive correlation. This will only magnify the risk associated with trading. As a result, traders can lose more money than they are willing to risk. Also, market participants can open one long and one short position for two positively correlated currencies. In this case, the losses in one case are likely to be offset by the winnings in the second trade. This can help traders to protect their trading accounts from serious losses.
- Some securities remain highly correlated to each other for many years. However, this relationship does not really have to be permanent. Some factors, such as changing interest rates, economic growth, inflation, and many other economic forces can significantly alter the relationship between two securities. One of the obvious examples of this is the divergence between the gold price and the Australian dollar. For years they move in the same direction. However, after the reserve bank of Australia cuts its interest rates repeatedly, the AUD became a much less attractive asset for investors and it started to fell. The rising prices of precious metals did help the Australian Economy, but it did not turn out to be much beneficial for its currency.


Comments (0 comment(s))