What is Elliott Wave theory and how to apply it in Forex trading
At some point in our lives most of us have wished that we could find a way to read someone’s mind. At the very least we’ve seriously considered how helpful it would be to know what people were going to do so that we could make an appropriate decision accordingly. Well, as you can imagine, this is something that forex traders have wished for a very long time. But because this is impossible, the players in the financial market have developed ways of using market patterns to help them to interpret technical data to help predict price movements. This is almost as good as reading people’s minds. One such technique that has been developed is the Elliott Wave Theory.
So, What is Elliott Wave Theory?
Well, the Elliott wave principle is a way of analysing market cycles and to predict trends by use of technical analysis to identify price extremes and interpret investor psychology. Now you may be seeing how helpful this is when applied in the financial world, like in retail trading. Because prices are determined largely by how people feel, and what they think about a particular economy or commodity, one could say that price is more dependent on human psychology and emotion than it is by rational factors. We say this because on more than one occasion financial markets have crashed, due to mass panic about a particular political or economic event that never truly materialized. I’m sure some of you retail traders may have noticed huge spikes in the market when there is no great financial news slated during those hours. These are prime examples of the power of hidden players within the markets. The infamous Black Wednesday incident where George Soros singlehandedly destroyed the British economy, with a simple trade is an excellent example of how strongly market psychology move markets. His simple move, prompted several other traders across the market to follow suit and dump the British pound, which caused the whole market to follow strongly in that direction. That move resulted in Soros’ biggest trade and a crippled economy in Britain.
Elliott wave predictions are based on the principles developed by one, Ralph Nelson Elliott, who used social principles to develop his analytical tools. The Elliott wave theory is based on what we refer to as crowd psychology and how it moves between the two extremes of optimism and pessimism. Now, to put this in simple terms, what the Elliott wave theory analysis does is to identify how large groups of people feel about a particular thing (whether they feel that it will perform well, or that it will perform badly) and interprets this information into graphic patterns that best traders can then use to predict market trends and price movement.
The Elliott wave theory basics are based on these principles, and as the name suggests the patterns that are created are in the form of waves.
Elliott through his analysis, found that market behaviour indicated that it moved in cycles, where the same behaviours were repeated constantly. He found that this pattern was displayed in waves, based on the psychological swings that took place (between optimism and pessimism). Elliot in his theory, says that the markets were like mathematical ‘fractals’. These are structures in mathematics that have a wave pattern on a smaller scale, just as they do on a larger scale. This is the same with the stock, commodities and forex markets.
The Elliott wave theory predictions that were made, were based on characteristics that he observed in the market wave patterns. The theory has a set of guidelines which help to identify which patterns the market is displaying, so the trader can the appropriate decisions regarding taking certain trading positions.
The Elliott Wave Theory Explained
Now, if you haven’t done so before, this would be the time to take out a pencil and paper. The principle of the wave theory says that the market shows two different types of waves. There is the impulse wave, which is the wave that follows the market trend, and usually is identified by the five waves that make up the pattern. The impulse wave may also be referred to as the motive wave. If you were to zoom in and observe the pattern on a smaller scale, then you would notice that this also consists of five waves, which repeat themselves the smaller and smaller no matter the scale that you observe the pattern. These smaller scales are referred to as wave degrees.
The second phase or the second type of wave that occurs in the financial market under the Elliott wave principle is the corrective phase. Now, the Elliott wave theory rules follow the knowledge that the financial markets are operated by forces that require equal and opposite reactions in order to have balance. For instance, every buy that a trader for a currency, there must be a seller at the other end selling you that same currency in exchange for the currency you are giving up in order to buy the currency that you want. (Say for example that you want to buy the EUR/CAD. Then you would have to sell your Canadian dollars in exchange for the Euro, that the other market participant is selling to you in order to buy your Canadian dollars.)
Because price is driven by these two opposing forces, it is sometimes prone to making sideways movements which the Elliott wave theory refers to as corrections.
Here are the following things to keep in mind when using the Elliott wave principle:
- Every price action in the market is followed by an equal and opposite reaction.
- Impulse waves move in the direction of the trend and have five waves. They are followed by three corrective waves.
- A complete cycle consists of this five wave-impulse and three wave-corrective moves.
- This cycle becomes two subdivisions for the cycle (5 impulse wave, 3 corrective wave, move).
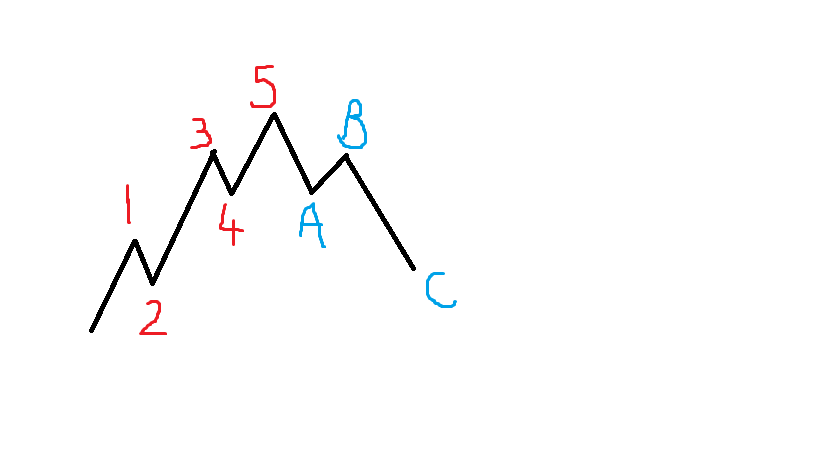
The picture above gives an example of a typical 5-3 wave movement that occurs within the financial markets. The numbers which are marked in red, indicate the impulse wave movement, while the letters marked in blue show the 3 wave corrective movement.
If we were to take a closer look at the impulse waves we would also see that they also contain even smaller waves within themselves.
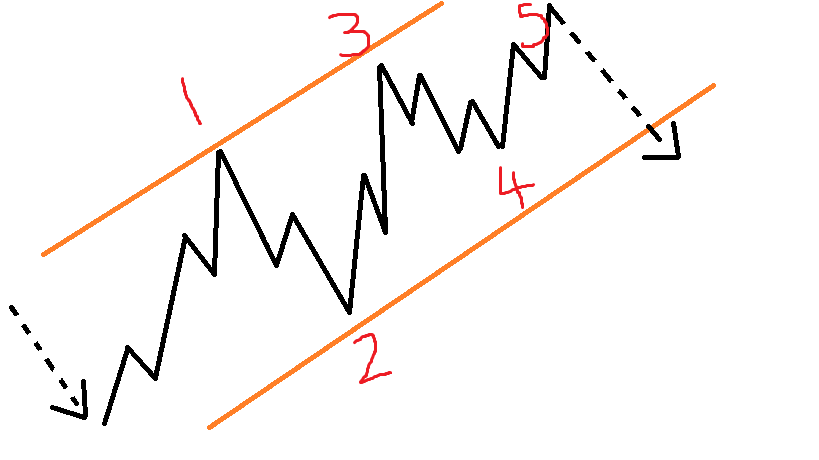
This is a closer view of the impulse movement, as you can see on a smaller scale, there are waves within the larger wave pattern that we observed earlier.
Unlike this picture, the corrective waves are usually identified by the three distinct movements that they make. Normally two parts of the structure move in the direction of the short-term trend (or the pullback, as you may already know it as) and one part of the movement that goes against it.
This means that two parts of the corrective wave will move in the direction of the correction, while one part will move in the direction of the main trend. We can observe this below:
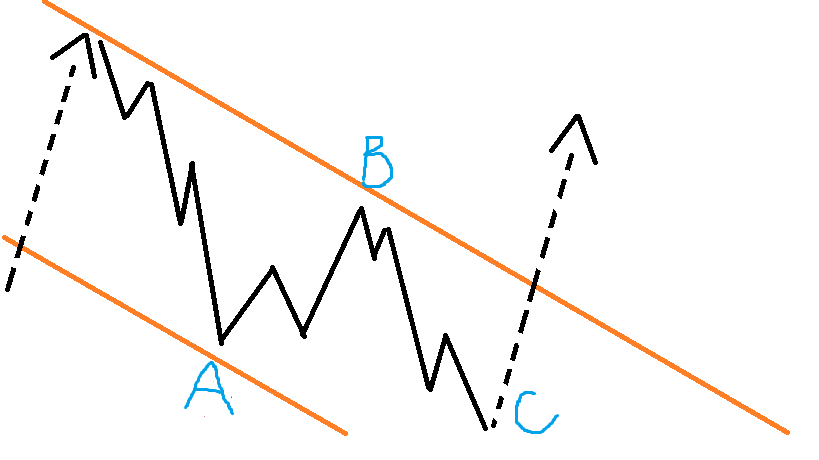
As we discussed earlier, the two parts of the Elliott wave cycle are only complete when the impulse wave and corrective wave are together. Please note that this does not only apply to a bullish market or uptrend as we have been showing in the examples, but this applies to downtrends or bearish markets as well.
Now, that we understand the mechanics of the Elliott wave theory, the next step is to know how to actually use it in your trading.
Theory Applied
So, how does one go about applying elliott wave theory profitably? Well, simply put, they use it as a supplement to their technical trading tools. This method would significantly help a forex trader who is having difficulty applying other technical analysis tools as it breaks down the formation of trend movements and retracements. With this knowledge, a trader is able to more accurately determine when a retracement will happen and will be better able to enter the market on time and properly take advantage of each opportunity presented. (He will be able to enter the main trends on the draw backs, and know when to close his positions on a main trend before the corrective wave occurs). Also, because the patterns formed are not dependent on time (they are the same no matter the time frame), a trader is still able to track and anticipate market movements no matter what time frame he is trading.
So, is Elliott wave theory accurate? Arguably, the answer is yes. Like any other technical indicator, it can be misused by the trader, and the market is not a rational being that will move exactly the same way all the time. This means that although, a trader can now anticipate what kind of movement the market will make, it is still very difficult to determine how strong the movement will be. The theory also does not take into account when trends change from bullish to bearish and vice versa. This is why using it along with other technical indicators is essential for a Forex trader. This will allow the trader to be able to confirm the signals given to him, when all of the indicators that he uses are telling him the same thing, he will know that this is a very strong signal that he will want to take advantage of.
For those who wish to learn about the deeper intricacies of the theory, they may simply google ‘elliott wave theory forex’ to get a better understanding of how the theory plays a role in the foreign exchange market, in particular. With this knowledge, you may be better able to adapt the principles of the theory to suit your specific trading needs.





Comments (0 comment(s))