
What is NFP and How to Use It in Forex Trading?
The non-Farm Payroll (NFP) numbers are one of the most important indicators in the Forex market. The actual report is released by the first Friday of every month. The purpose of this indicator is to measure the total number of employees in the USA. However, it does allow for some exceptions. For example, Agricultural workers, as well as some government departments and non-profit organization employees.
In most economic calendars on broker and Forex news websites, they do not depict the total number NFP, but rather a numerical change compared to the previous month. For example, if we take a look at this type of calendar, on February 7, 2020, there will be an entry for a non-Farm Payroll report, which would show 225K. This means that during the previous month, in January 2020, there were 225,000 more jobs in the US, compared to December 2019, excluding those three categories, mentioned above. The indicator can also show some negative numbers as well. The example of this would be April 3, 2020 report, where it showed -701K. This means that during the previous month, in March there were 701,000 fewer jobs, compared to February.
The non-Farm Payroll report can have a significant impact on the currency exchange rates, especially when it comes to USD-based pairs. The main reason for this is the fact that it is one of the essential indicators for the overall health of the American economy. So if the latest NFP shows some notable gains in job-creation, than this can certainly support the exchange rate of the US dollar. As a result, the currency pairs, like EUR/USD and GBP/USD, might fall notably, while USD/JPY and USD/CHF might make some gains.
Obviously, the opposite is also true. If the latest NFP report shows very few gains in employment level, or even worse, some job losses, this can indicate the overall weakness in the American economy. As a result, the US dollar might depreciate against other major currencies such as the Euro, the British pound, the Japanese yen, the Swiss franc, and others.
Finally, it must be mentioned that the Forex currency pairs always have two sides of the coin. So during the decision-making process, it might be worthwhile to check the economic indicators of other countries as well. For example, in recent months, US NFP numbers showed massive job losses, however, sometimes USD did not fell because some other countries’ economies are experiencing even worse challenges. So this is something useful to keep in mind during Forex trading.
Understanding Non-Farm Payroll Numbers
After going through the basics of the Non-Farm Payroll numbers, the next question is: how does it affect the markets? Well, to answer this question we can turn to this 15-minute EUR/USD chart, where we can check the price action before and after the NFP announcement on May 6, 2020:
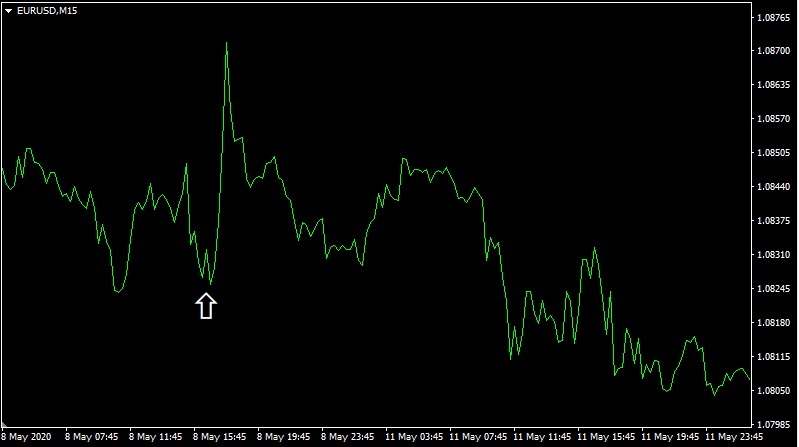
The analyst consensus for this month stood at minus 22 million when the actual numbers came out, they were slightly better. The report showed that during April, the US lost 20.5 million jobs. As we can see from the chart above, the immediate market reaction to this announcement was dollar selloff. The EUR/USD pair has gained up to 50 pips in a very short space of time. However, after this panic selling of the American dollar, there was a reversal and the pair fell steadily for the next 3 days until reaching $1.0810 level.
So what can be the possible reason for this rather unpredictable market reaction? Well firstly, it is useful to point out that losing more than 20 million jobs in a single month is a very bad piece of news for the American economy, even if it is lower than the analysts’ consensus. In fact, for an individual to find anything resembling this scenario, he or she has to go all the way back to the great depression of the 1930s. Therefore, clearly many traders and investors were shocked by those massive job losses and sold the US dollar.
If this economic downturn was confined to the United States, then it was likely this USD downtrend to continue. However, after some time many traders and investors realized that the other parts of the world were also suffering from very serious economic challenges. Also, the actual number was 1.5 million lower, than as many analysts expected. Finally, as once more a low-yielding currency USD benefited from risk-off trades as well.
As we can see from this real-life example, trading NFP is not always about the market simply going to one direction or to another. Sometimes, it can get very complicated. So, for example, when analyzing EUR/USD pairs during the NFP announcement, it is very helpful to take a look at the latest indicators of the Eurozone economy as well, instead of only focusing on those job numbers in the US. By extending their analysis to both currencies, traders can improve their chances of opening winning positions.
NFP and Economic Trends in USA
Changes in the Non-Farm Payroll numbers can give traders and investors valuable clues about the latest economic trends in the US. To illustrate this, let us take a look at this chart, which shows the NFP changes in the US during the last 20 years.
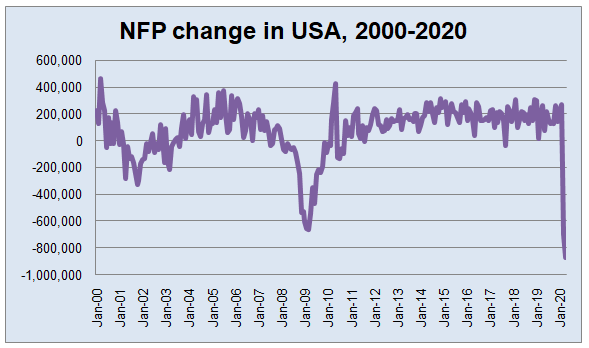
As we can see from the above diagram, since 2000, the US economy has gone through 6 stages. Firstly, there was an economic boom in the late 90s, even as late as 2000, there were months, where the rate of job gains exceeded 400,000. This strong economic performance has also benefited the US dollar tremendously. From 1995 to 2001, the USD has made massive gains, eventually overcoming the parity level with Euro. By 2001, the EUR/USD pair was mostly trading within 0.85-0.95 range. In fact, in October 2000 the pair reached an all-time low of $0.8231.
The Single currency was not the only one who depreciated against the dollar during this period. The US dollar steadily appreciated against the British pound, with GBP/USD eventually dropping to 1.40. Finally, the American currency also has seen some gains against the Japanese yen, with the USD/JPY going above 130 mark.
This period was followed by an economic downtrend during 2001-2002. At that time, the monthly job losses mostly fluctuated between 100,000 to 300,000. The rising unemployment even extended into 2003, however by the end of the year, the economy showed some solid signs of recovery. The Latest NFP numbers were showing job gains the first time during the last 2 years, with GDP growth rates picking up as well. During the next 4 years, the average monthly job gains were roughly 200,000. This strong economic performance persisted until the credit crunch of 2007.
The heavy job losses at the start of the Millenium had a very negative impact on the strength of the US dollar. Since 2002 the USD ended into a long term downtrend against other major currencies, which lasted until 2008. For example, the rate of EUR/USD has risen from 0.85 to 1.59 during the course of those years. The British pound has also appreciated against the dollar, climbing from 1.40 to above 2.00 level. The American currency also lost some ground against the Japanse yen, as USD/JPY fell to 100 level.
Currency Rates and NFP After 2008 Great Recession
Returning to our NFP chart, we can see that there was a large bottom in employment during 2008 and 2009. After losing hundreds of thousands of jobs, at one point the monthly job losses even exceeded 600,000. In fact, it was only in 2010, when the economy has shown some tangible signs of recovery.
Now, here logically, due to poor NFP figures and other poor economic indicators, one would think those developments would have weekend the USD even further. In fact, many market participants and financial experts have gone as far as to talk about the upcoming collapse of the dollar. However, it was all proven wrong.
The thing was that it was not only the US, which was suffering from the economic crisis, many other economies were just as affected if not worse. Therefore, this environment triggered risk-off trades in the market, where the US dollar benefited from its safe-haven status. As a result, the USD started to make some notable gains. This is well illustrated on this daily GBP/USD chart, depicting the movements of this pair during the great recession:
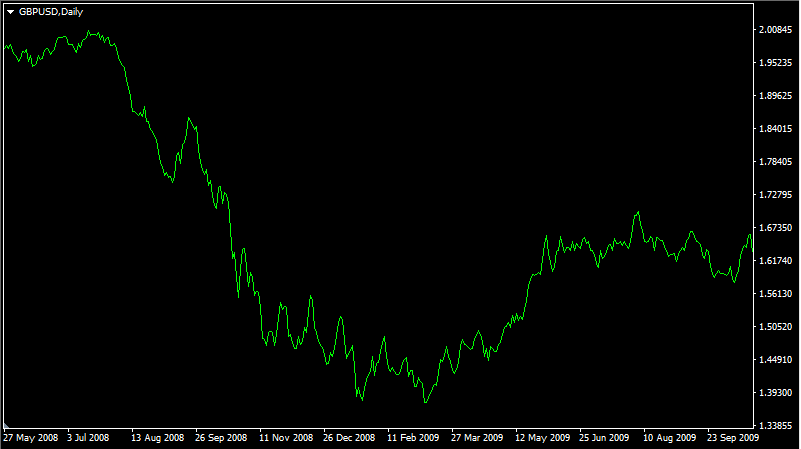
As we can see from the above diagram, even as later as July 2008, the pound was trading close to 2.00 level against the dollar. However, since August, the American currency made some rapid gains. By the end of the year, the GBP/USD was already trading at $1.40. So this means that in a matter of 5 months, 6 years’ worth of gains have been wiped out and the pair was back to square one, returning to 2002 levels. Actually, after some period of volatility, as the UK voted to leave the European Union, the GBP/USD downtrend has resumed, with the pair trading around 1.26 level at the beginning of June.
The great recession also marked an end to the Euro uptrend against the dollar. The pair never returned to 1.59, instead, it fell close to 1.30 level.
Can NFP Predict Recessions and Economic Booms?
So here we have an obvious question: Why not just use Gross Domestic Product (GDP) figures to measure the US economic performance? What is the reason behind traders and investors attaching so much importance on non-Farm Payroll figures? Well, here it is helpful to remember that timing is very important in trading and investing. GDP reports are mostly published on a quarterly basis and it takes some weeks after the relevant period for the report to be published. Instead, NFP figures are ready at the very beginning of the next month.
Consequently, this allows the traders and investors to get some early clues about the upcoming recession, before GDP and other economic figures can confirm the fact. So, essentially, NFP is a very fast and convenient indicator for market participants, which helps them to get some idea about the latest developments in the US economy in a timely manner.
Here it is worthwhile to mention that one negative NFP number does not automatically mean that the county is heading for a recession. For example, we can see from the NFP chart that during one of the months of 2017, there were some job losses. However, it was turned out to be just one-off decline, from the next month the country resumed to make notable gains in employment. So, in order to identify the signs of recession, one needs to take a look at the patterns, rather than on just one individual NFP report.
Do NFP Numbers have any Impact on Commodity Prices?
When discussing how to trader NFP, it is helpful to point out that, the impact of those announcements is not strictly limited to USD-based pairs like EUR/USD, GBP/USD, USD/JPY, and others. Sometimes it can have a major influence on commodities as well, such as gold, silver, and oil prices. At the beginning of this article, we discussed, how did the Euro/Dollar exchange rate respond to the latest NFP announcement. So obviously, here one can wonder, what was the response of gold price after the release of those numbers.
To answer this question, we can take a look at this 15-minute gold price chart:
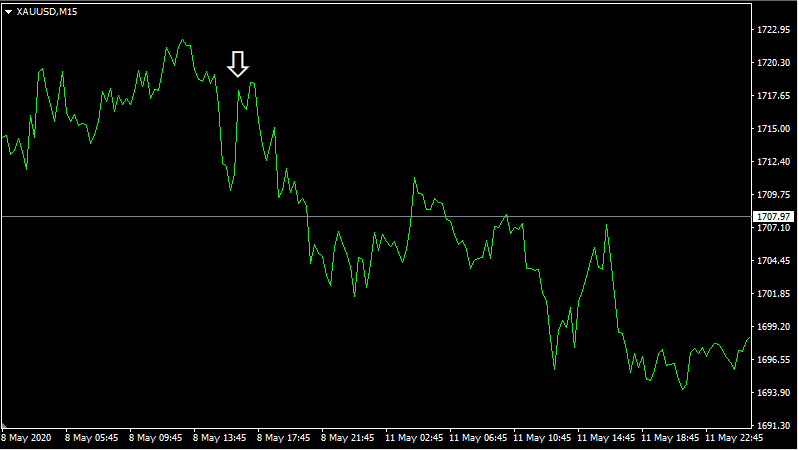
As we can see here, just before the report came out there was a surge in the price of this precious metal, in anticipation of bad news for the American economy. However, after the publishing of NFP, the XAU/USD fell steadily, declining from $1,717 to $1698 during the next three days.
This is not surprising since the gold price benefits from US economic weakness in two ways. Firstly, everything else being equal, the announcements which show bad news for the American economy typically weaken the US dollar. Since this currency is one of the components of the XAU/USD pair, it strengthens the price of this precious metal.
Secondly, many financial experts and professional traders agree, that gold usually benefits from fear and uncertainty. So if the latest economic numbers show the signs of the upcoming recession, it can certainly push XAU/USD price much higher.
As mentioned before, losing 20.5 million jobs in one month was bad enough, however, since it was 1.5 million lower than the analyst consensus. Therefore, it seems like some traders took this as somewhat of a good sign for the American economy and sold the gold in the process.
Trading Non-Farm Payroll Announcements
Many professional traders typically avoid opening USD-based positions before the non-Farm Payroll numbers announcements. The reason behind this is that it is very difficult to predict whether the latest report will be in line with the analyst consensus, or whether it will exceed or miss those forecast. It can also happen that after the release of the latest numbers, for some time the market might make a massive move in one way, but later change the direction.
To illustrate the example of such a scenario, let us take a look at this 15-minute USD/CHF chart:

As we can see from the diagram, in this case shortly after the announcement, the USD/CHF exchange rate dropped sharply, falling by 40 pips. However, after this initial move, the dollar recovered and made some steady gains for the next 3 days. Eventually, it was proven to be very short-lived, as the Swiss franc turned the tide and started to appreciate against the US dollar, before stabilizing around $0.97 level.
So as we can see from this example, the market moves right after the NFP announcement can be highly unpredictable. Trading during those times even with a stop-loss order in place can be very risky. After all, those types of orders do not always guarantee a minimum price for closing positions. In times of extreme market volatility, there is a chance that the trade might be closed at a lower price, compared to the one specified in the stop-loss order.
Therefore, many experienced traders wait for some time after the announcement of NFP, to analyze the latest moves and see where the market is eventually heading. In our example, if a trader rushed into shorting USD/CHF immediately, he or she might have lost a significant amount of money. On the other hand, those traders who gave the market some time had an opportunity to see, that the USD/CHF pair changed its direction and then act accordingly, avoiding those potential losses in the process.
Limitations of NFP
Despite all of its advantages, it might not be the best idea to open trades solely based on the non-Farm Payroll reports. This is because this indicator does have several disadvantages as well. Here is a list of few of those:
- This indicator is usually expressed as raw numbers, rather than by percentages. Over the long term, the US population increases, for example back in 1990 it stood at just above 250 million when by 2019 it has surpassed 328 million. So adding 100,000 jobs back in the 90s is not the same thing in relative percentage terms as doing so in 2020. Yet, unlike the Consumer Price Index measure, there is no mechanism NFP for adjusting for population changes. This makes it very difficult to compare NFP numbers from different periods of time and come up with accurate analysis.
- NFP numbers measure the actual number of employees, however, it says nothing about their earnings or working hours. Consequently, we might have a scenario when it can be very misleading. For example, the indicator can show massive expansion in the labor market but fail to mention that most of those employments represent just part-time jobs. Or alternatively, there can be a scenario where wages are stagnating for years and obviously there is no information about this in NFP reports.
- It is easy to find GDP, CPI, and unemployment measures for countries outside the US, so that trades can compare the relative economic performance of different nations. However, the use of NFP is not as universal as those indicators mentioned above. Consequently, some countries simply not have the equivalent of non-Farm Payroll numbers, while others measure this indicator completely differently. So this makes it difficult to make NFP comparisons between different nations.
Why NFP Exclude Agricultural Sector and Some Government Employees?
Many trades and investors wounder why NFP does not include people employed in agriculture, or why does it exclude non-profit organization employees and even some government workers. Would this indicator not be more complete and informative if it also takes account of those categories? Well, St.Louis Fed had several explanations for this:
- The Agricultural sector is very much subject to seasonal fluctuations. Unlike the normal full-time job, the people who are employed in this sector, they do not have to be working on regular hours in order to grow their crops, for example. There are months, where farmers have to work for long periods of time, while during other months it does require any hard labor. Therefore, adding the numbers of agricultural workers to NFP can make this indicator very misleading.
- There is a great deal of informal employment going on in the agricultural industry. Farmers might employ their family members or friends without employment contracts. Therefore, it would be a nearly impossible task to prepare accurate NFP reports for this sector.
- NFP reports exclude the US military members, also employees of Central Intelligent Agency, National Security Agency, and some other Federal agencies. There are essentially two reasons for this. Firstly, there are national security concerns. If the US published detailed reports for its military, CIA, and NSA activities, it can easily end up in the wrong hands, so it makes sense not to make those sensitive pieces of information available to the public. Also, the increase or decrease in the military person has very little to do with the country’s economic performance. It is more dependent on the actual threats that the nation has to face.
Basic of NFP Trading – Key Takeaways

- NFP is one of the most important indicators for the US economy. Therefore, it can have a major impact not only on USD-based pairs but on commodity prices as well. Under normal circumstances, massively expanding the employment base is a sign of strengthening the economy and can certainly benefit the US dollar, while also very often putting pressure on gold and oil prices.
- If NFP indicates job losses it does not always necessarily mean that this would always lead to depreciation of the US dollar. For example, during 2008 the American currency benefited from safe heave status since there was a global financial crisis. So it is always helpful to check economic indicators of other countries as well, before making trading decisions.
- NFP figures are published during the first Friday of every month. Consequently, it is a very fast and convenient measure, which has the ability to inform the investors and traders about the possibility of an upcoming recession, before it can be confirmed by actual GDP figures. However, just like any other indicator, it does have its imperfections. Therefore, it might be a better idea to use NFP numbers in conjunction with other economic indicators, in order to conduct more accurate analysis.


Comments (0 comment(s))