
Forex Currency Correlation
When we hear the word correlation, we think about a connection between two or more things. With Forex, when we talk about correlation, we are generally referring to currency correlation. If you have ever observed that when certain Forex pairs rise in value, other ones fall, then you have witnessed this type of correlation in action.
Currency correlation is generally used as a way of measuring how two financial securities move in relation to each other. We can do this, because no currency pair moves independently of all the other ones. This is because currencies are traded in pairs and many pairs share either the same base currency or counter currency.
How does it work?
Correlations are written by using what is known as a correlation coefficient. This is a statistical way of measuring how strong the linear relationship is between two variables. It is calculated using the coefficient formula.
Wow, now that looks complicated!
Luckily for those of us who aren’t as mathematically gifted, the internet does a pretty good job at helping us calculate correlation coefficients so that we can use it in our trading. You can find a FX correlation coefficient calculator or maybe even a currency correlation chart with a quick internet search, but before you can interpret the answers that you get, you must first know what they mean.
The correlation coefficient exists on a scale between the numbers +1 and -1. These are the numbers highlighted in red.
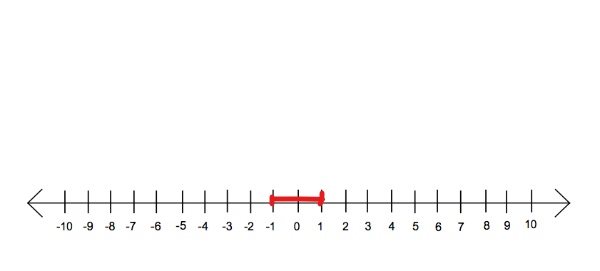
Because the coefficient exists on a scale, this means that there are degrees to how much pairs relate to each other….or how alike they are in their movements. If two currency pairs get a coefficient of +1, this means that they have a perfect positive correlation. This indicates that the correlated currency pairs will move in the same direction all the time. The closer that the coefficient gets to -1, the more opposite they move to one another. If two currency pairs have a coefficient of -1, this means that they have a perfect negative correlation and will move opposite to each other 100% of the time.
There is a chance that the coefficient between two pairs may come up as the number zero (0). If this happens, this indicates that the two pairs have absolutely no correlation to each other and one pair’s movements does not affect the other.
All about the Visuals
As FX traders we tend to enjoy charts, and diagrams because they take a large amount of information and cram it into a simple form that is easy to understand. So, what does a FX trader do when he needs to remember the coefficient for two pairs that he is trading? Well, he turns to what he knows, something simple and efficient: the currency correlation tables.
Finding a currency correlation table is just a google search away, but what you may notice is that the tables that you see do not have an absolute value for the currency pairs that they are being compared. Instead, you may observe that there are different values given over different periods of time (usually an hour, a day, a week, a month and sometimes even a year). While some new traders may think of this as confusing and maybe even unnecessary, this is in fact a great tool for a trader to have. This is because different traders hold their trades over varied periods of time. So, a day trader may look only at the hour and day values, while a swing trader may be interested in only the day, week and monthly values. Both sets of traders may adjust their positions to include FX pairs that work in their specific favors.
| EUR/USD | AUD/USD | GBP/USD | USD/JPY | USD/CAD | EUR/JPY |
| 1 hour | +0.91 | +0.54 | -0.48 | -0.9 | +0.57 |
| 1 day | +0.2 | +0.71 | +0.19 | -0.88 | +0.74 |
| 1 week | -0.03 | -0.25 | +0.45 | +0.09 | +0.89 |
| 1 month | -0.12 | -0.11 | +0.27 | +0.04 | +0.67 |
This is an example of the type of table that you may find during your search. In this currency correlation table the EUR/USD pair is being compared to five other currency pairs ( AUD/USD, GBP/USD, USD/JPY, USD/CAD, EUR/JPY). We can clearly see that while some pairs start off being positively correlated to the EUR/USD pair, that degree of correlation changes over time. The very first example, the AUD/USD, started off with a strong positive hourly correlation with the EUR/USD, but ended the monthly period with a weak negative correlation.
For those of you, who are still worried about what these bunch of numbers actually, mean, don’t worry. There is a ranking system that most traders use to determine the meaning behind the coefficient numbers that they get from their tables and calculators. The table below is a guide to interpreting these numbers.
| -1.0 | Perfect negative correlation |
| -0.8 | Very strong negative correlation |
| -0.6 | Strong, high negative correlation |
| -0.4 | Moderate negative correlation |
| -0.2 | Weak, low negative correlation |
| 0 | No correlation. Pairs are independent of each other. |
| +0.2 | Very weak, insignificant positive correlation |
| +0.4 | Weak, low positive correlation |
| +0.6 | Moderate positive correlation |
| +0.8 | Strong, high positive correlation |
| +1.0 | Perfect positive correlation |
How Do We Use It?
So, now that we know what forex currency correlation is and how it works, the question remains, How exactly do we use it? Traders generally use it as a tool to achieve the following:
- To stop trading counter productive pairs
- To diversify their risk
- To double their profits
- To avoid the fake-out trap
To Avoid Counter Productive Pairs
As a trader, using correlation currency pairs can help you to stop trading in a nonproductive way. This is because if a trader understands how the currency pairs move in relation to each other, then he would be more likely to avoid taking positions on pairs that cancel each other out. For an example (using the first table) we can see that the EUR/USD pair has a very strong hourly negative correlation with USD/CAD pair, so a daytrader who decides to take a long position on both of these pairs would be making a huge mistake. These pairs move almost opposite to one another and a trade like that could prove to be very expensive.
To Diversify Risk
Traders also use fx currency correlations to diversify their risk. If a trader understands how the pairs relate to each other, then he can use the forex currency correlation strategy to spread his risk across two or more pairs. Now the key to reducing your risk using this method is to pick pairs that do not have a perfect correlation, but are strongly correlated. For an example, if you are trading the daily chart and you were thinking of opening a long position (a buy) on the EUR/USD, you could reduce your risk by splitting your trade between two currency pairs. You could do this by opening one smaller long position on the EUR/USD and another small long position on the GBP/USD. If the USD makes a spike in value, this could help lessen the risk, as the British Pound and the Euro may react differently to the spike. (One may be more stable than the other).
To Double Profits
The third way that a trader may utilize the currency correlation coefficient is as a tool to double their profits. Many traders are more eager to take advantage of this feature of the currency correlation strategy (ie. spreading your positions across pairs that move strongly together).. Taking a position on two pairs that move strongly in the same direction could allow the trader to ‘double-up’ their return. If the trader is careful with the pairs that he chooses, this method could also carry less risk than taking a double position on the same currency pair.
For example:
A swing trader takes a short position (a sell) on the EUR/USD using the monthly chart. He realizes that the trade is right at an important resistance level. He expects the Euro to fall significantly in the next month, so he wants to double his position to maximize his profits. If he looks at the currency correlation table then he will notice that the EUR/JPY has a correlation of +0.89 on the monthly period. According to the ranking system, this means that it has a ‘strong, high positive correlation’. It would be less risky for him to take another short position on the EUR/JPY instead of adding a second position to the EUR/USD. Using this way he has diversified his position, and lessened his risk.
To Avoid the Fake-Out
Lastly, Forex traders tend to use currency pairs correlation to avoid getting stuck in a fake-out trap. The fake-out is an infamous trap that many traders get into when they are trying to trade a breakout on a currency pair.
Picture this:
You are watching the USD/CHF hourly chart. For the last 4 hours the pair has been in a tight consolidation and has formed a triangle pattern. Some important news on the US dollar will be released in the next fifteen minutes and you can begin to see some volatility on the pair in anticipation of the news.
The news hits, and the pair breaks out in a clear buy signal. You pride yourself on good entries, so you take the buy. The pair is moving in your direction and you start to feel good, when against all sense, the USD suddenly drops! Unfortunately for you, you forgot to place your stop loss and now you are in significant loss. The USD continues down in a strong movement. It is officially a sell off! You know that it will probably continue like this for the next few hours. You close your position feeling disappointed.
What we just described above is a fake-out trap. It is something that many traders find themselves in, particularly when they are still new to trading. One of the ways to avoid this trap, is to know which currency pairs move oppositely to the one that you are watching for the breakout.
Using the example before, if you were trading the USD/CHF, one way to avoid that fake out would have been to look at either the GBP/CAD or the GBP/NZD pairs which have a currency coefficient of -0.88 and -0.87 respectively. (Both strongly negatively correlated to the USD/CHF). If these pairs showed a clear sell signal, then you would have confirmation that the USD/CHF would be going long. If you had looked at these pairs for confirmation though, you would have probably seen that they weren’t showing any signs of a strong sell signal, and then you would have known that the bullish spike was a fake-out trap that you should avoid.
Take Aways
Like with any type of Forex tool, forex currency correlation can be used as a great way to increase a trader’s success. It is however, not a stand alone feature. A trader needs to be properly prepared before using any new tool in his trading. He must have a great understanding of how the tool works, and the risks involved in using it. Using fx currency correlation, encourages traders to trade multiple pairs at the same time. It allows the trader to be able to avoid trading counter productive pairs, to double his profits, to diversify his risk and to avoid the infamous fake-out traps that can drain his account. With all these positive possibilities, many traders get carried away. It is crucial to remember that the most important part of trading is knowing and managing your level of risk. It is only then, that you will be consistently profitable.
It is Important to note that while there are no current currency correlation indicators offered by MT4, it is possible to find downloadable indicators online that visually show the trader when two pairs are moving together or apart strongly. They are fairly easy to find online, but as with anything unfamiliar, one should exercise caution. We suggest only risking real money with these indicators after rigorous testing. There are free versions online, but if you decide to pay for one, ensure that it is compatible with the trading platform that you are using before purchase.


Comments (0 comment(s))