
Most important Forex indicators all Forex traders should know
Every technical trader out there, whether he is in forex or stocks or even commodities, trades based on the information that he sees on his price charts. Generally, those who call themselves technical traders, fall into two main groups: those who trade based on price action (this is the movement of prices across a screen.) and those who use what we call indicators. There are, of course, others who use other methods like order flow and statistical trading, instead.
In trading, an indicator is a mathematical formula that shows traders a visual image of price movement that is then used to make decisions. Some traders use multiple trading indicators because they believe that it will provide a clearer picture of how the market is moving, so that they can better predict the next movement and take advantage of it. While indicators can be helpful with this, a trader must remember that they are not ‘the holy grail’ of trading. And for many skilled price action traders, they could get the same information from an indicator by simply analyzing a naked price chart. (A naked price chart is a chart with nothing but price movement on it). That being said, the main thing that the forex indicator offers is simplicity.
Forex indicators can be very helpful because of how simple they make things. This is why they are especially a great for beginners. Using these forex trading indicators can allow new traders to analyze more complex data like price volume, and can make it easier for them to accurately identify trends, reversals and pullbacks.
Forex Indicators Explained
One of the worst things with human beings is the way that we need other things to make sense. For many people there must be some rational way in which things move, or behave in order for them to understand. If things do not fit into their way of thinking, it appears to be chaos to them. This is the same with the forex market. It does not have to behave rationally. The sooner that a new trader understands and accepts this, the better it will be for him, because he will not become trapped in wrong trading attitudes like feeling personally attacked when a trade goes badly, or engage in revenge trading.
Everything is not chaos however. Although the markets may not move rationally, they do repeat behaviours. This repetition creates patterns. This is why we have support and resistance levels, trends, and range patterns. Experienced and successful traders take advantage of these to make profits, because they can anticipate how the market will move based on these patterns.
Because indicators are made of formulae that make use of historical price data, they also give an indication of where the price is moving based on how it moved in the past. The best forex trading indicators that work are those that are sensitive enough to show price pattern changes, but stable enough so that they do not change direction in normal market volatility. The best indicators for forex trading are also those that are easy to understand. If they are, then there is a less chance of the trader making an error because of confusion.
Popularity Contest – Proven Best Forex Indicators
In forex best indicators are ones that make life easier for the trader and identify proper entry and exit points that the trader can use. The best forex indicators, are arguably the more popular indicators. A google search for ‘forex best indicator’ or ‘best indicators forex’ will yield a variety of results, many of which are arguably very confusing for new traders. The best forex indicator will be one that is simple to understand yet effective. So, any indicator that is very difficult to understand should be ignored. There are currently five indicators that almost every trader knows well. They are as follows:
Simple Moving Average
The simple moving average is arguably the most popular forex trading indicator used in the forex market. Every trader knows about it in some way or another. It is also a forex indicator that is versatile. Because of this it can be used in both long term and short term trading. The simple moving average is calculated by using the mean price (the mathematical average) for a specified time period. For example, the popular 20 SMA (20 simple moving average) is simply the mean of the closing prices for the last 20 periods. (If you are looking at a day chart, it would be 20 days, If you are looking at an hourly chart it would be the last 20 hours.) To calculate this by hand we simply divide the sum of the closing price for the last 20 periods by the number of periods which is 20.
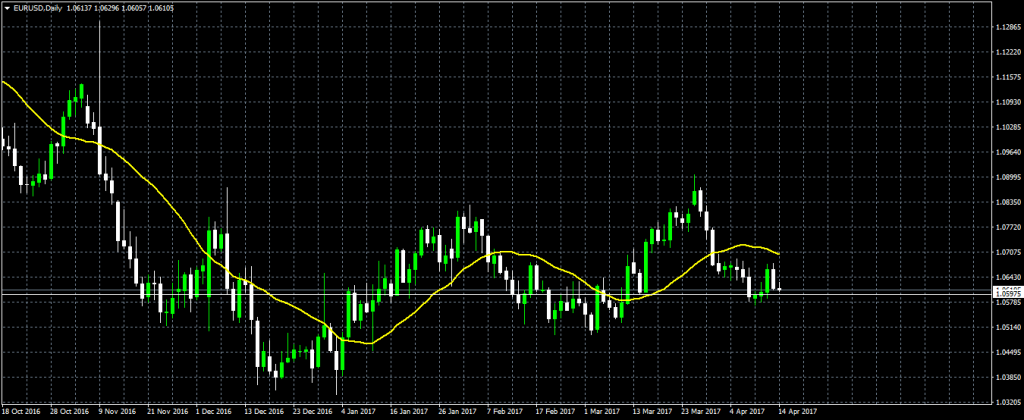
The 20 SMA is shown here by the yellow line.
The reason why some people consider it the best indicator for forex, because it is very simple to use and understand. The simple moving average smooths out price movement, so that trends can be identified more easily. Because the SMA uses the average of past price movement, this means that it is a lagging indicator. It can only show you the trend after the trend has started. The larger the time period used to calculate the SMA, the slower it will be in moving with the trend. (Example: A 100 SMA will be much slower than a 20 SMA). Because of this, many traders use either more than one moving average (usually one fast moving SMA and one slow moving SMA) or use the SMA with another type of forex indicator.
The reason why the SMA is so popular is because it makes it much easier to identify how the market is moving because it generally smooths out the price volatility, making it easier to identify proper trends. If the SMA moves up, this means that the price of the currency is going up, if it goes down, it means that the price is going down.
Bollinger Bands
Like the moving averages measures show a trader the trend direction, the bollinger bands shows a forex trader the market volatility (or what some traders refer to as market noise). Market volatility can also be used as a way to identify market direction. For many traders, they use Bollinger Bands to identify, in particular, ranging markets.
Bollinger bands are one of the best indicators for forex when a trader wishes to identify how volatile the market is being. It acts as as a volatility channel, showing that the more farther apart the bands are, is the more volatile price action is. The more narrow the bands are, the more stable the price movement is.
The Bollinger bands indicator is calculated using two things: 1. The number of days that will be used for the moving average and 2. The number of SDs or standard deviations away from the moving average that the bands will be placed.
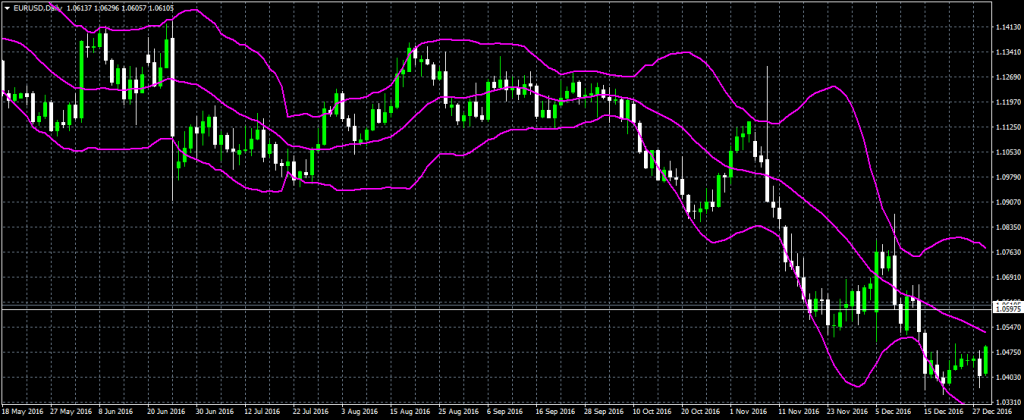
These Bollinger bands have a standard deviation of 2, which is the usual setting used by traders.
The MACD
The MACD stands for the moving average convergence divergence. It is arguably, the best forex indicator used to show price momentum (how strong the trend is). Forex traders tend to use it as a way to confirm trend. So many traders use it with other types of indicators that identify trend like the moving averages.
How the MACD works is that it is a combination of two moving averages, the 26 EMA (exponential moving average) and the 12 EMA, which are subtracted from each other. After this a 9 EMA is plotted on top of the MACD as a signal line, where buy and sell signals can be identified.
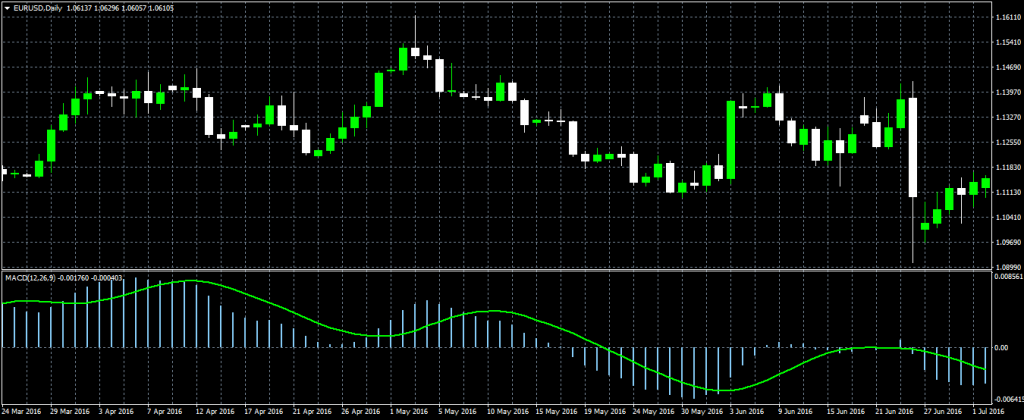
The MACD is shown at the bottom of the screen below the candle sticks.
Like the moving averages, traders tend to use the MACD crossover methods to indicate signals that they use to place trades. (This would be where the green line crosses over the outer edge of the other line). They also use divergence or when the MACD and the price of the currency move away from each other to identify the end of the identified trend.
When trading with the MACD the trader also wants to watch for the levels at which the indicator is at. Usually when trading this indicator when the MACD is above the zero level, then it means that the fast moving SMA is above the slow SMA so this indicates an upward momentum (so traders usually buy). When the MACD is below the zero level it means the fast SMA is below the slow SMA and indicates a downward momentum.
Fibonacci Levels
Fibonacci levels are popular in the trading community, particularly the fibonacci retracement. Among technical traders, it is the best forex trading indicator used to identify price pullbacks. It based on the idea that after a major price move in the market, price tends to retrace. So many traders use it to successfully trade price retracements on major trends. The Fibonacci retracement uses the fibonacci sequence (which was popularized by a mathematician – Leonardo Fibonacci) which is expressed as ratios. The sequence of numbers starts from 0 and 1 and the number that comes next is always the sum of the last two preceding numbers. For example: 0,1,1,2,3,5,8,13,21,34,55 etc.
The Fibonacci retracement is usually done by taking a major point, usually the highest and lowest point of price within a period and dividing that vertical distance in ratios that are written as percentages. (The ratios are calculated by dividing one number in the sequence with the number immediately following it.) The percentages are : 23.6%, 38.2%, 50%, 61.8% and 100%. On these percentage levels, we can use to identify areas of support or resistance that forex traders can use to their advantage.
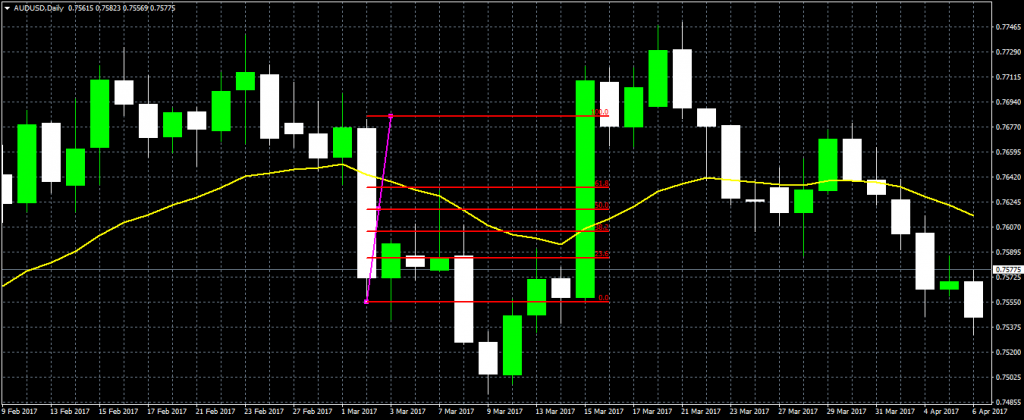
Here the magenta line indicates the points where the Fibonacci retracement was drawn. It was drawn from the highest point on the long bearish candle (the white candle) to the lowest point on the candle on the AUD/USD Daily chart. The fibonacci levels are indicated in red. To get a clearer movement of price action we move to a shorter time frame, the 4H chart.
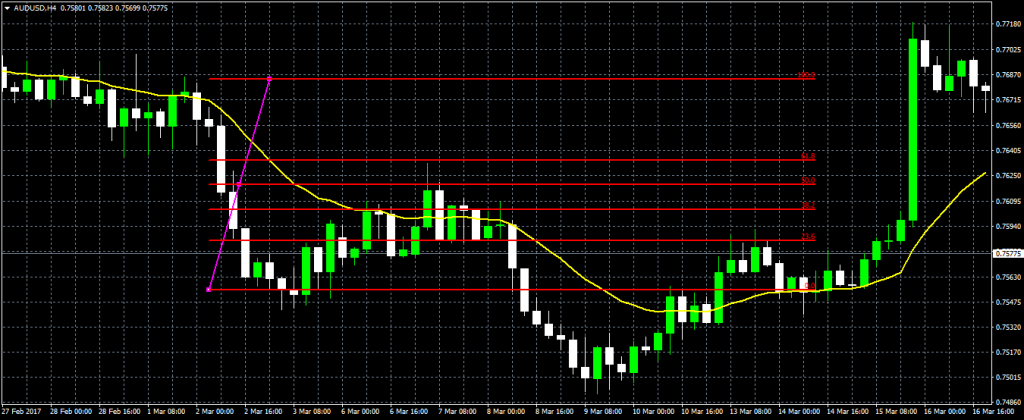
As we can see on this 4H chart, the price retraces to the 61.8% level before returning down, even going past the last level of the fibonacci retracement lines 0.0%. If a trader had placed a sell limit order at this level he would have made a successful trade.
RSI
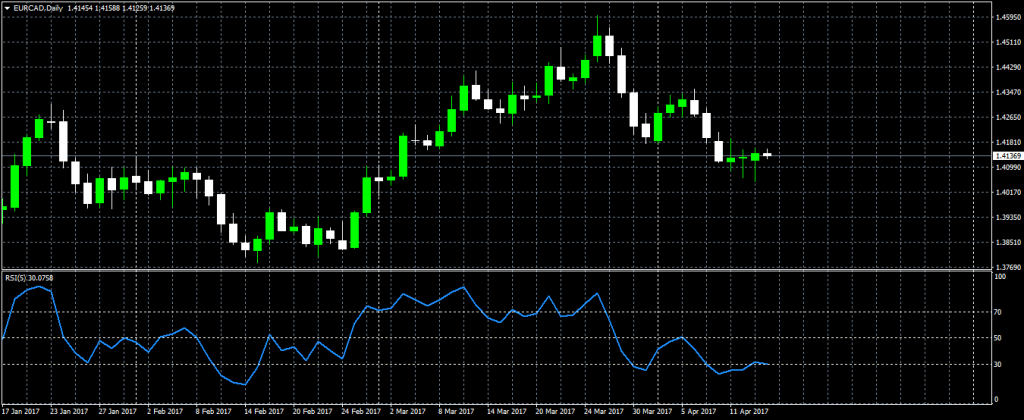
RSI stands for relative strength index and this popular forex indicator is an oscillator that measures the speed and the change of price in the forex market. It is used to indicate the exhausted areas of the market, where price is either overbought or oversold. Traders use this to help them to predict when the trend is about to change and a reversal is about to take place.
The price is generally considered overbought when it is above the 70 RSI level, and considered oversold when below the 30 level.
For the best results the RSi is to be used in a fairly stable market, as sudden price spikes can contribute to false signals. The strongest forex indicators tend to be those that trader use in combination with other indicators. The best forex indicator combination is one which uses indicators that complement each other’s’ functions. For the RSI, it is best used in combination with an indicator that confirms trends like the MACD or an indicator like the fibonacci retracements that shows areas where price will pullback.
The Best Indicator for Forex Trading
The best indicator for Forex trading will be the one that caters to a trader’s needs. If a trader trades mainly based on the trend on longer time frames then the simple moving averages may be a good option for him along with other indicators like MACD to identify how strong the trend will be. Used together these indicators can provide confirmation to the signals that one indicator or strategy may give. The more indicators confirm a signal, the stronger it is and the more likely that it will result in a profitable trade if taken.


Comments (0 comment(s))