AUDUSD Analysis – will the price break iH&S neckline?

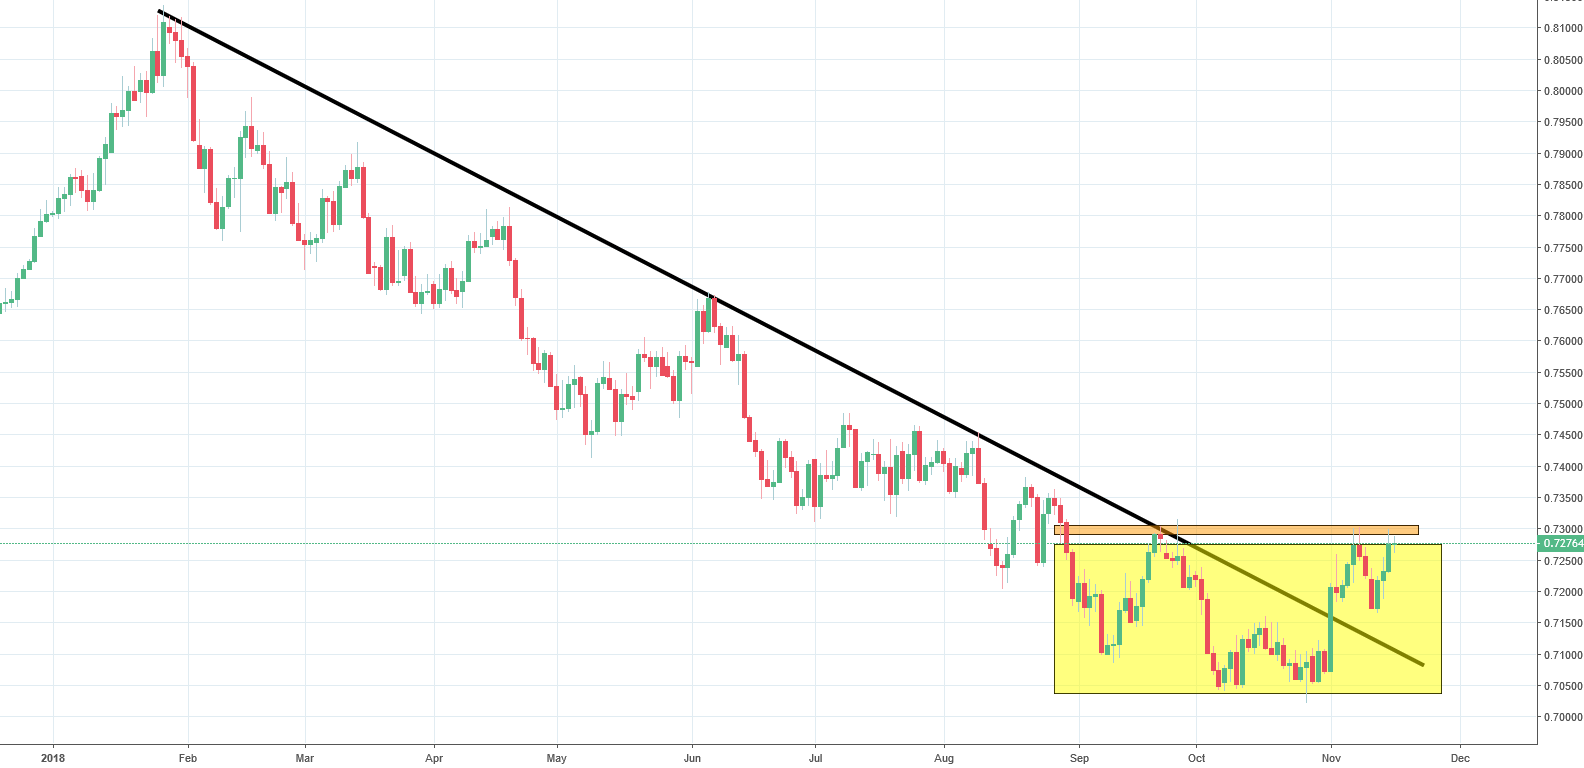
About a month and a half ago we took an optimistic stance on AUDUSD. Although the price was going through a deep decline, it was nearing a support and we expected a bullish correction to occur. We expected a correction to begin as soon as the price broke a long-term downtrend line shown on the graph below in black.

Our prediction turned out to be exact. There was a reversal in the price movement and it breached the downtrend line as well. The low established end the end of declined also turned out to be the head of an inverse head and shoulders formation which is highlighted on the graph in yellow. The formation is suggestive of a bullish reversal, but for the technical analysis to draw any final conclusions, the price has to break the neckline. The neckline is drawn with an orange horizontal line. It is a crucial meter for the analysis. If the price doesn’t cross the line, there will be no buy signal triggered. However, if it does manage to break it, we will expect more growth to come.


Comments (0 comment(s))