CADCHF Analysis – price in decline but no need to be hasty!

A week ago we took a bearish stance on CADCHF without issuing any specific trading signal. The price of the currency pair was following a symmetric triangle pattern and not nudging in either direction. If the price crossed the purple line shown on the graph below, it would definitely trigger a sell signal and if it bounced back and broke the upper line of the triangle, it would issue a buy signal. We thought the breakout of the support more likely and expected the price to decline sharply.
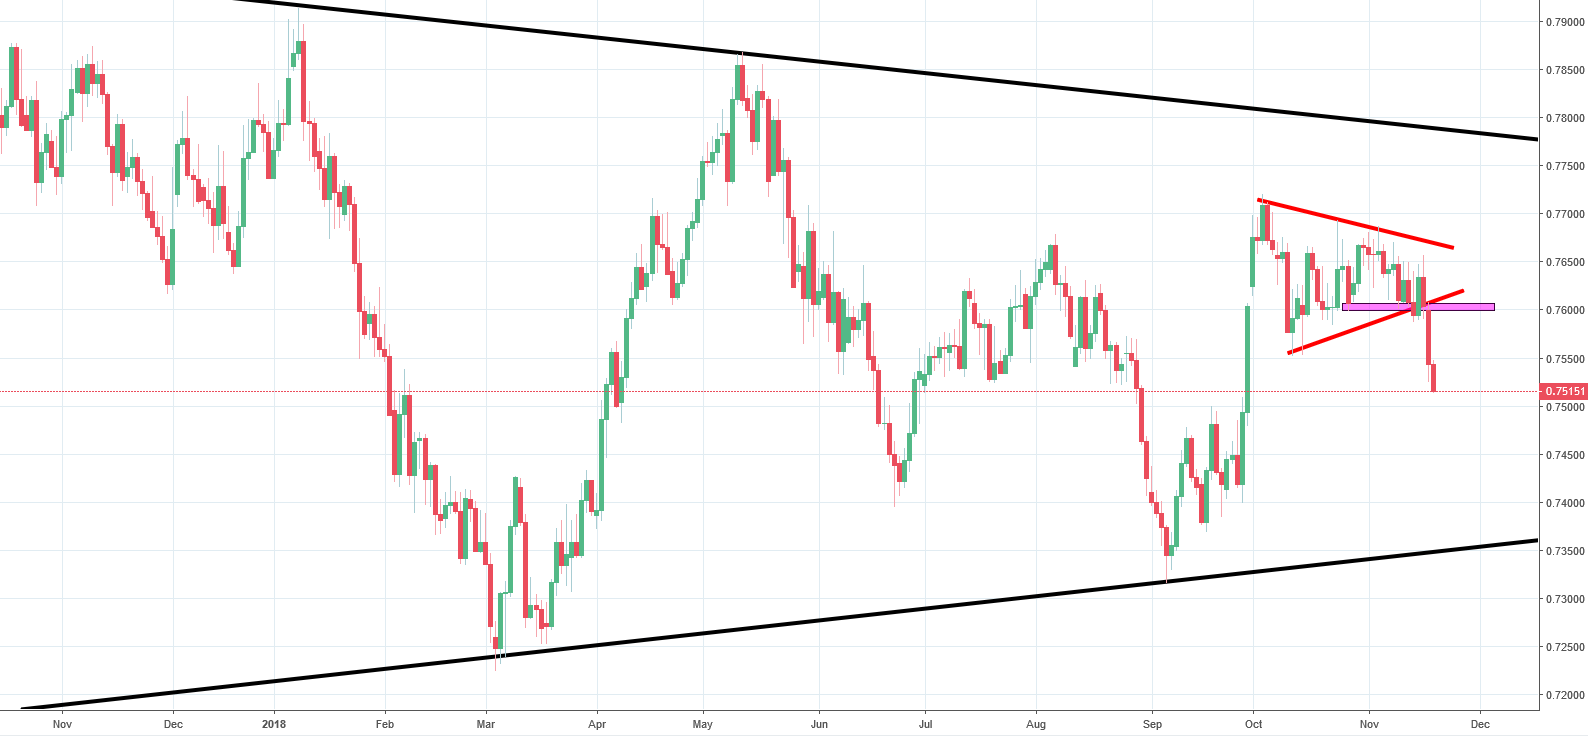
This is exactly what happened. On Monday, the price broke the purple support and triggered a massive drop in the price. The next milestone for the price will be the lower line of a bigger triangle pattern, which is drawn in black. The risk to reward ratio is worse in the current situation and there is a higher chance of a bullish correction. This means that it is not yet a good time to go short on the pair, although the distance to the lower line of the bigger triangle might suggest otherwise. Instead, we suggest waiting for a correction and shorting the currency pair afterward.









Comments (0 comment(s))