USDCAD Analysis – several milestones in sight

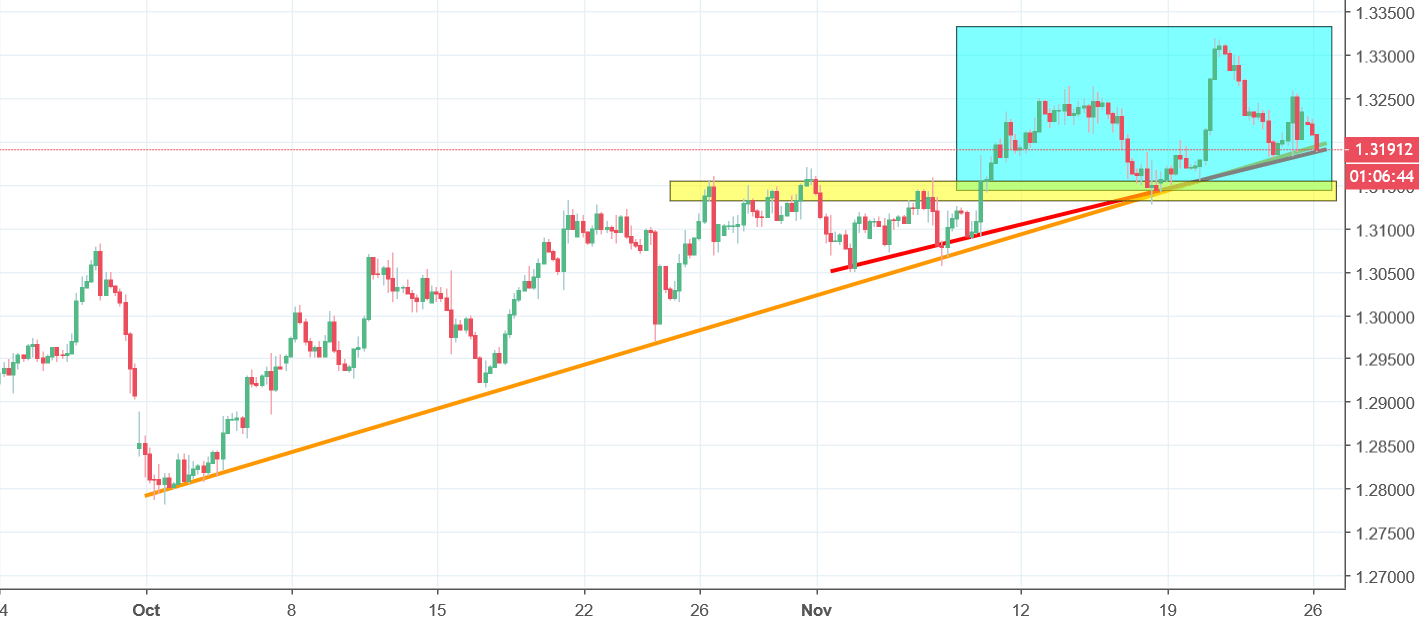
USDCAD has shown an interesting pattern in the latest weeks. Just over a month ago we expected the price to experience large gains. The price had two obstacles to overcome after which it would trigger a strong buy signal. First of all, there was the upper line of the flag pattern shown on the graph with a red line. Secondly, the price was also nearing the neckline. If the price closed above these two levels, it would introduce a positive sentiment in the market.

Our expectations were proven right as the price crossed the two milestones mentioned above. Like expected, it triggered a period of growth which lasted over a month until the 21st of November. At that period, the price also established new local highs, which might lead some to expect decline, but that is not necessarily so. While the chances of a drop are not very low, the price is currently tracing a head and shoulders pattern shown in blue. If the price manages to break the mid-term uptrend line, a strong sell signal will be triggered and the sentiment will change to a negative one. On the other hand, there’s also a horizontal support line nearby, so if traders want to avoid risk, they might want to wait before the price breaches the resistance as well.


Comments (0 comment(s))