SiaCoin Analysis – precipitous decline following an ascending triangle

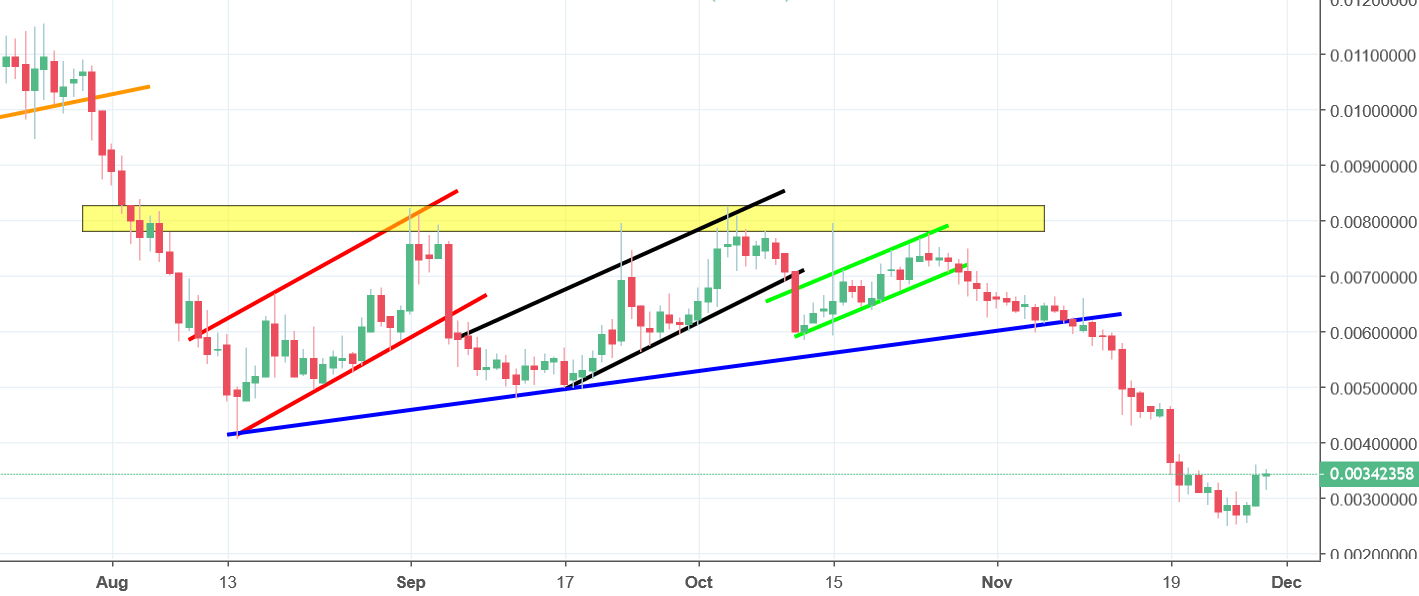
SiaCoin might not be as well known as some of its more popular counterparts, but its price movements are definitely interesting for the technical analysis. Traders might find this asset more appealing than some of the bigger ones. At the beginning of November, we took a negative stance on the cryptocurrency, but the price was following the logic of technical analysis, which made its movements easier to forecast. SiaCoin was tracing an ascending triangle pattern and a bearish breakout was very likely. If the price crossed the lower line of the pattern, it would trigger a sell signal and promote a further decline.

The technical analysis was extremely accurate this time as on November 10, the price broke the lower line of the triangle formation triggering a strong sell signal. The drop that followed was extremely precipitous as it halved the value of the coin in a matter of days. Currently, there is a bullish correction in the price, but we are not taking it as a sign for a reversal. Instead, we maintain our negative outlook for the asset and warn traders against investing in the cryptocurrency at the moment. The price should continue declining in the nearest future as the reversal isn’t expected to be very big.


Comments (0 comment(s))