Gold Analysis – counterintuitive movements in price

The meeting of the presidents of the US and China is having widespread consequences for many different types of assets. Many didn’t know what to expect from the meeting as the presidents have previously shown a hostile attitude toward each other and there seemed to be no sign of an agreement. Yet, it went well and as the risks of a trade war are now mitigated, the investor behavior is changing as well. The assets that are traditionally considered safer investments like CHF and JPY have declined while the riskier assets including EM currencies and stocks have seen gains. Gold, on the other hand, is behaving strangely. It is usually a safe haven which means that it should have gone down, but the movements of the asset are experiencing strang oscillations.

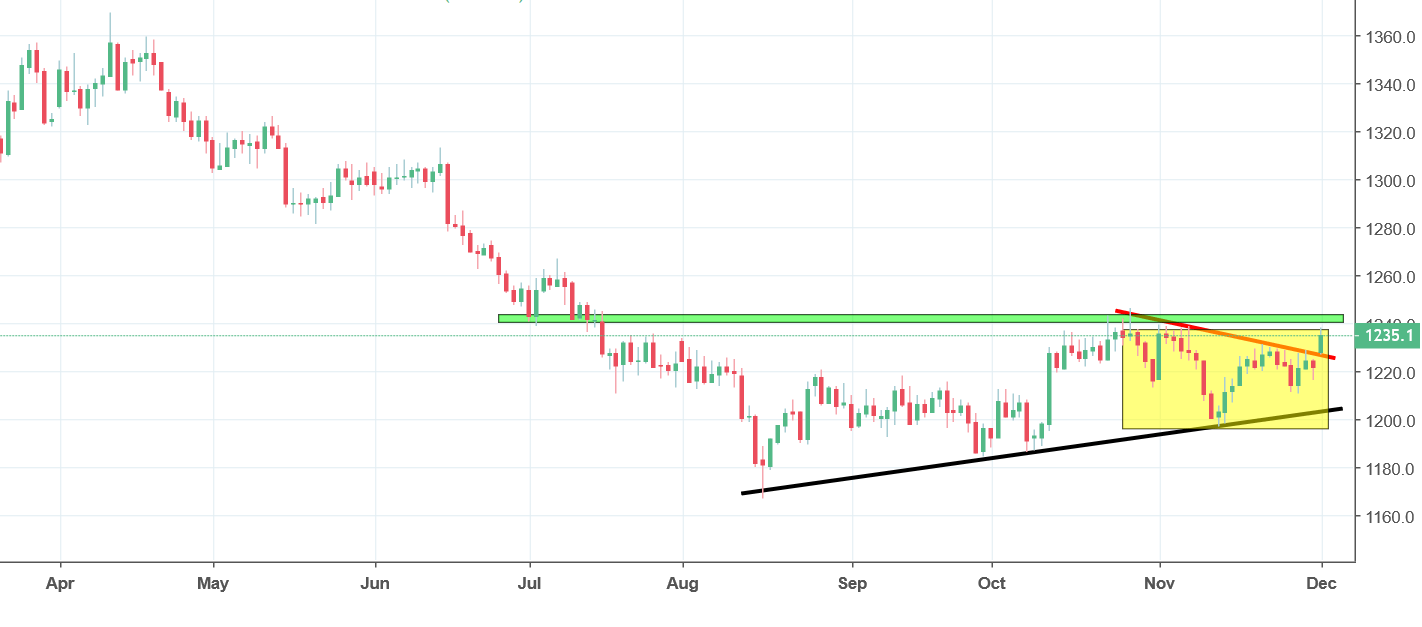
About three weeks ago the price of gold was above a psychological barrier at 1200 USD/oz as we took a bearish stance. It was tracing a flag pattern which we took as a trend continuation pattern and concluded that a downturn was in sight. The strength of USD reinforced the idea as well. If the price broke the line of the flag pattern, which we expected it would, it would trigger a sell signal. The price didn’t end up breaking the dynamic support and no sell signal was issued. The price, instead, bounced back and started to trace out an inverse head and shoulders formation highlighted in yellow on the graph above. The price broke the neckline as well, thus triggering a buy signal. For the long-term, the price would still need to break the resistance line shown with a green line to change the sentiment.


Comments (0 comment(s))