Factom Analaysis – the only cryptocurrency with a positive movement

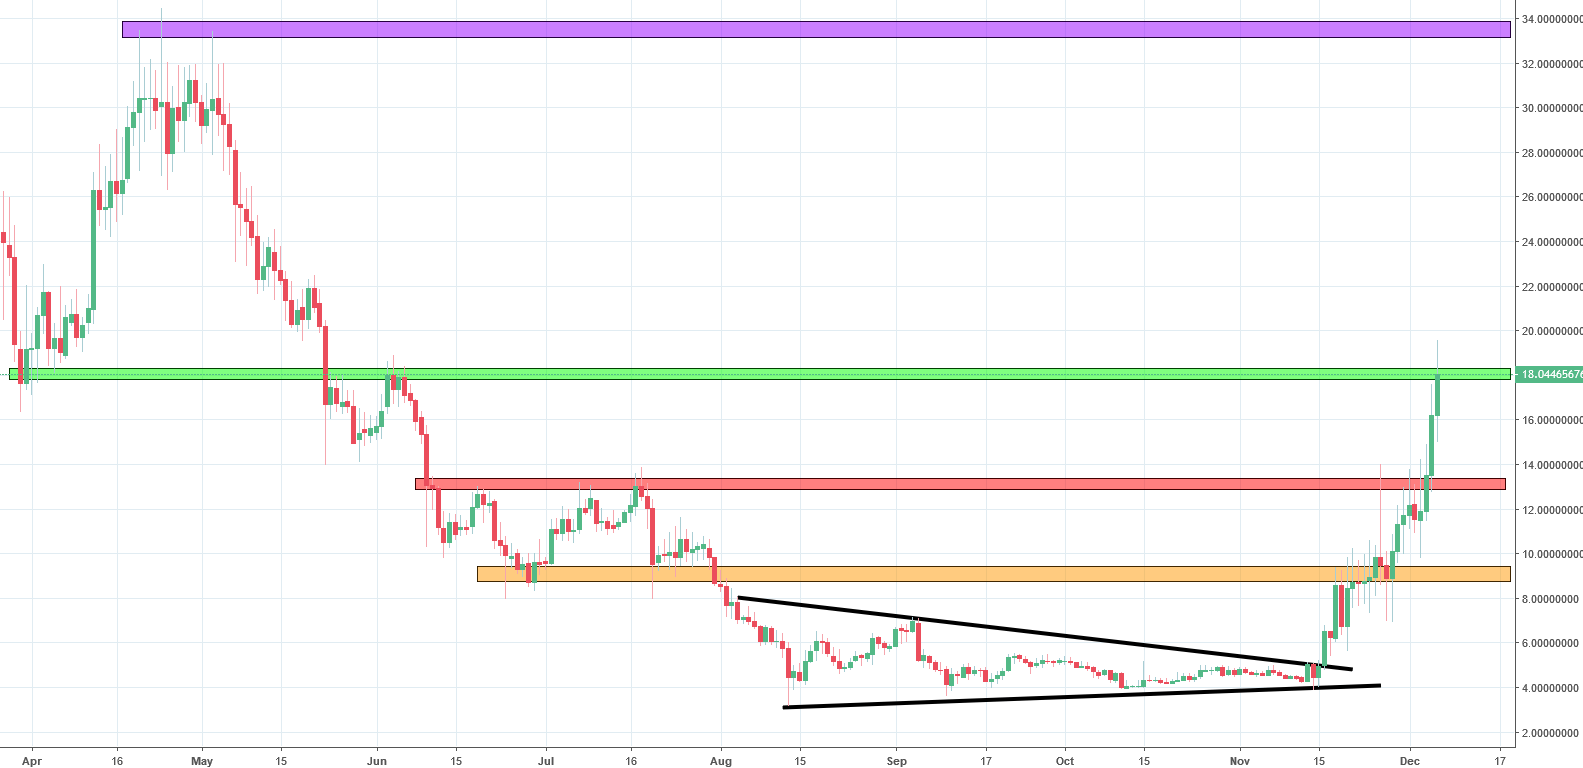
Sometimes the smaller, less famous cryptocurrencies turn out to be the most profitable ones. This might be the case with Factom which has been performing exceptionally well the last couple of days although many assets of the same type are suffering. Previously we touched upon Factom at the beginning of September when its price stood at $6.81. As there was a clear flag formation in the price movements we took a bearish stance on it. This idea was further reinforced by the fact that the price was below the horizontal resistance line at $8.3 shown on the graph below in orange. We expected the price to breach the lower blue line and thus trigger an even further drop.

As we expected, the price did indeed break the lower line of the flag and experienced a sharp decline from $6.81 to $3.72. Furthermore, in October, the price of Factom started to follow a triangle pattern shown on the graph with black lines. This time, the price breached the upper line of the formation which resulted in a buy signal and an upward movement. On its way up, the price has now broken two resistances, an orange and a red one. At the moment, it is near the third resistance shown with a green line. While this could lead to a bounce-back and a bearish correction, we expect the price to break the resistance considering the momentum it has gathered. The fact remains that Factom might be the single cryptocurrency that has this positive of a movement on the market. Depending on how it behaves at the green resistance, there’s another one shown in purple which will be its next target.


Comments (0 comment(s))