Crypto foreacts – potential trade opportunities for EOS, Monero and Stellar Lumens

Out of over 1,500 cryptocurrencies, it’s very difficult to know which ones may have good trading opportunities. However, we can focus on a few of them for now that have shown predictable chart patterns. Keep in mind that this crypto report is heavy on the technical analysis, so you also have to have an ear to the ground for any news on crypto coming out. For now, we have selected EOS, Monero and Stellar Lumens, which were all great performers. In fact, with the exception of Monero, the rest are currently in the top 10 on CoinMarketCap. So let’s get into it:
Will EOS maintain the bullish spike in price?
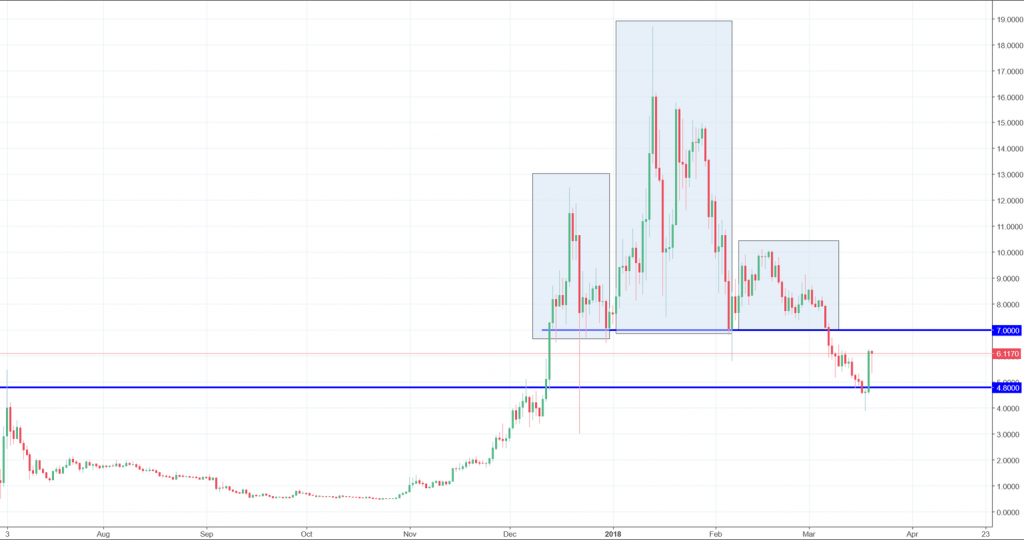
Two weeks ago, the future of EOS seemed dire following a break below the support level at $7. Prior to this, the cryptocurrency had formed a head and shoulder pattern as you can see from the image below. Usually, this is a sign of a trend reversal, and this signal came true. Following the break, prices spiralled downwards but were fortunately held steady by another support level at $4.8. At this point, a doji candle was formed and the downtrend was reversed to the upside.

At the moment, EOS is trading at around $6.10 and seems to be headed toward the resistance at $7. However, it is unlikely that this resistance level will be broken through very soon. It seems like most of the rise in value came from South Korea because Bithumb brought 44% of all the demand. Due to this, it is plausible that the bulls will be exhausted and prices drop once again after reaching $7 and fall back to $4.8.
Still no clear breakout for Monero
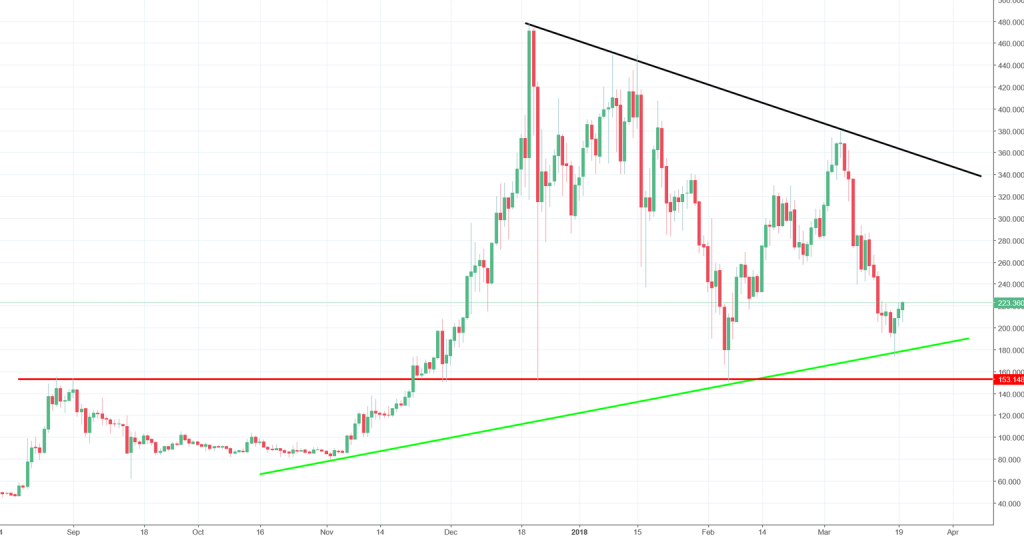
As for Monero, this coin has been stuck within a triangle for more than three months. Obviously, with this kind of setup, traders will be looking for the breakout, which is bound to be huge when it does come. For the moment, though, we’re still stuck here, but that doesn’t mean we can’t trade Monero. According to our crypto report, the green line trending upwards and the black line going opposite can define this triangle. With no signs of a breakout, we just have to trade the bounces between these levels, although the support around $153 adds a bit of a twist.

As you can see, this support kept prices higher back in February in addition to the dynamic support of the trendline. The latest bounce can be spotted on the green trendline. Furthermore, on Sunday last week, a hammer had formed at this point providing a better signal that indeed the trendline would hold. Thereafter, the candles started to form higher highs and higher lows to show that the trend reversal had begun. Therefore, out crypto report on Monero shows that the coin is heading up to reach the black trendline. For short-term buyers, this is the perfect opportunity to catch this trend with targets around $300 and beyond.
Now, the Stellar Lumens crypto report…
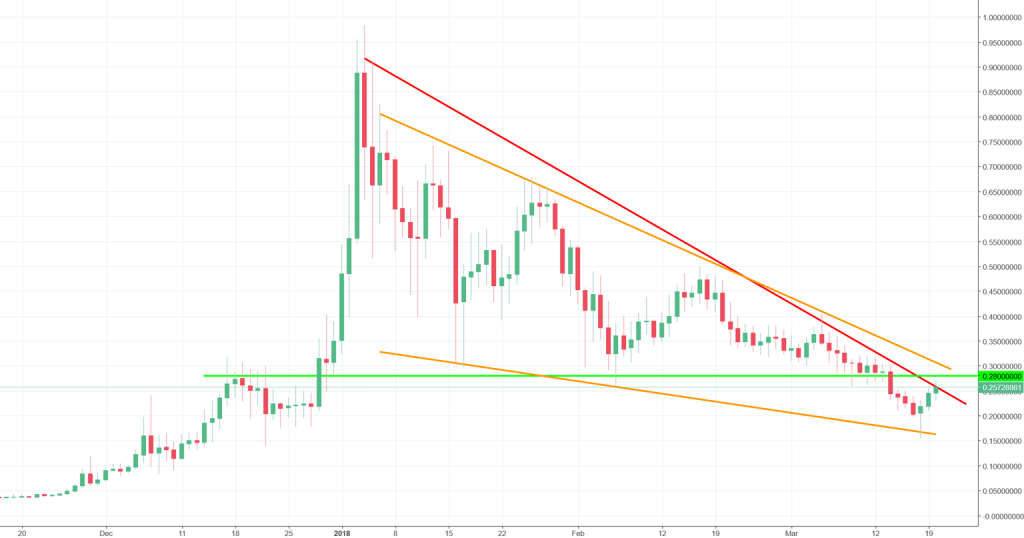
Last week was defining for Stellar Lumens’ crypto report after its value dropped below a strong support at $0.28. Nevertheless, we could have seen this break coming with the help of the red trendline indicated in the chart below. This trendline showed that there was overwhelming selling pressure, even enough to break a major support level. The price movements of Stellar Lumens now have the coin in a bearish wedge marked by the orange trendlines.

The lower trendline was confirmed to hold strong following the bounce on Sunday with the creation of a hammer. This week, the rally began toward the resistance at $0.28, even breaking the red trendline, but the bulls were unable to break the resistance. In the short term, we may be in for another bearish trend back to the lower orange trendline. However, a breakout above $0.28 and the daily candle closing above this level would be the best signal to go long on this coin. On the fundamental analysis, it would seem that Stellar Lumens has both good and bad things going for it, so it is crucial to observe the news for signs of trading direction.


Comments (0 comment(s))