EURCHF Analysis – breach of the flag pattern triggers a sell signal

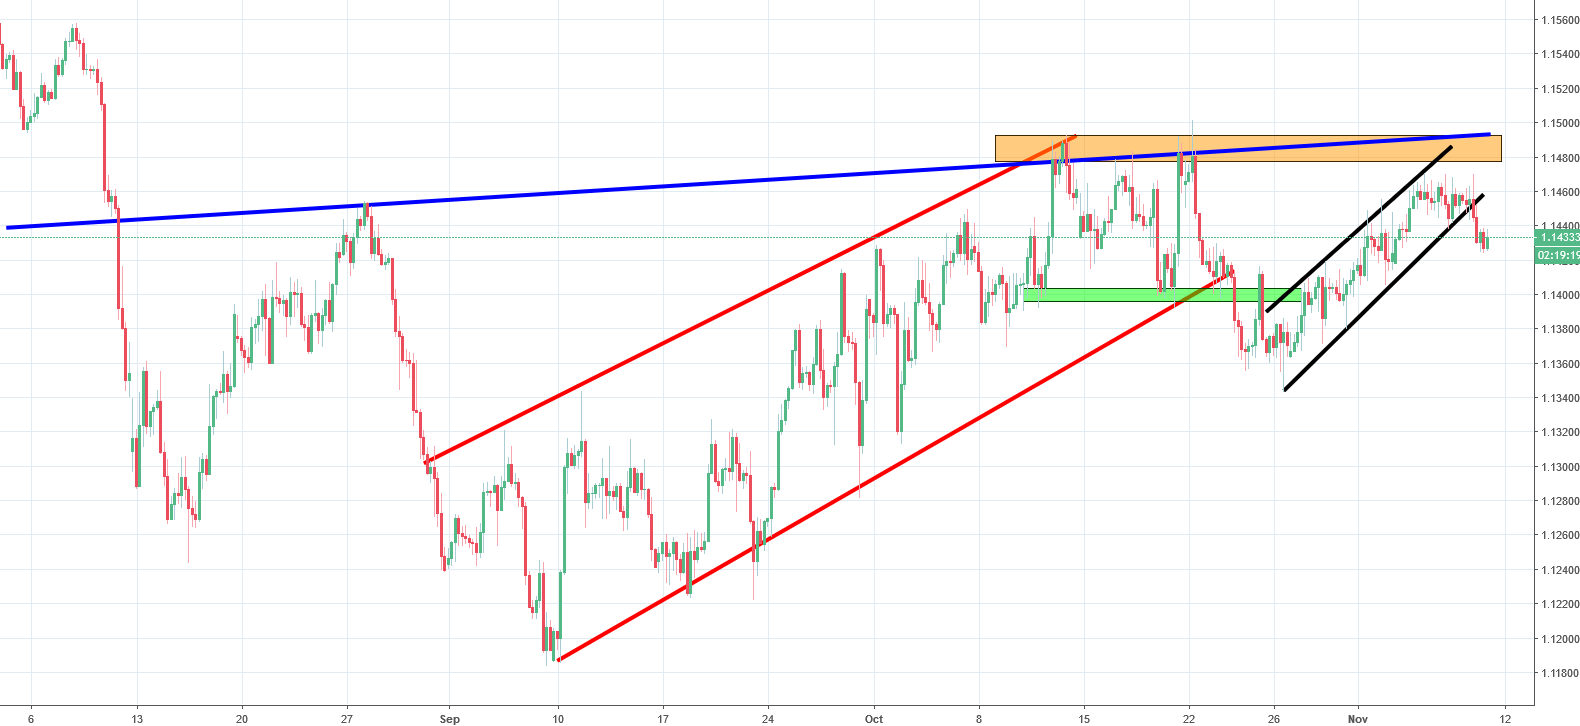
We previously analyzed EURCHF a few days ago when the price was forming the right shoulder of an inverse head and shoulders pattern. We expected the currency pair to trigger a major buy signal if the price breached the neckline. The breach of the neckline would coincide with a horizontal resistance marked on the graph below with an orange color, as well as 38.2% Fibo.

Unfortunately, the price dropped and didn’t manage to cross the above-mentioned marks. This could serve as a lesson to the traders who want to preempt the market. Sometimes, it is wiser to wait for the breakout to happen before making any rash trading decisions. Patience is a key part of trading and it could be the way towards gains. The price started to trace a flag pattern, which is shown on the graph above with black lines. During the past few days, the price breached the lower line of the pattern and triggered a sell signal. We are maintaining a negative view of the outlook of the currency pair and expect a further decline to take place in the nearest future.


Comments (0 comment(s))