
EURUSD Analysis – interesting volatile movements in the price

A week ago we took a negative stance on EURUSD currency pair as the price had recently broken a green dynamic support triggering a strong sell signal. After that breach, we predicted the price to reach the lower line of the symmetric triangle and although that prediction turned out to be true, the way to the line was way more volatile than expected.
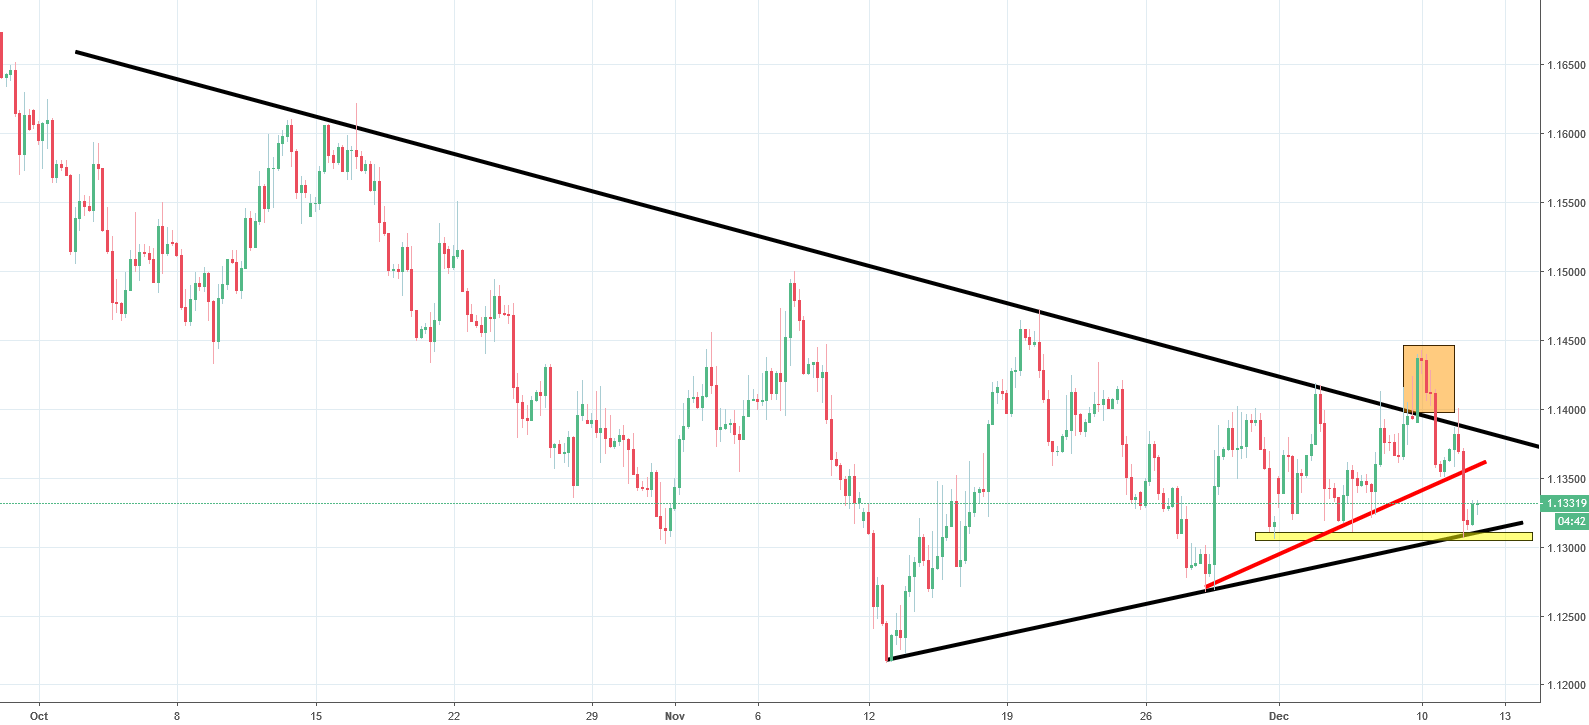
Before going down, the price experienced a quick gain and a false bullish breakout highlighted on the graph above in orange. The price dropped below the black line swiftly and this false breakout reinforced the negative sentiment on the market. Today, the price has bounced from the lower line of the symmetric triangle pattern mentioned above. The bounce-back also coincides with the yellow horizontal line at 1.310. While this could be taken as a positive signal, it would only affect the short-term prospects. The true sell signal will be issued if the price manages to close below the yellow horizontal support.


Comments (0 comment(s))