USDJPY Analysis – broken neckline leads to more decline

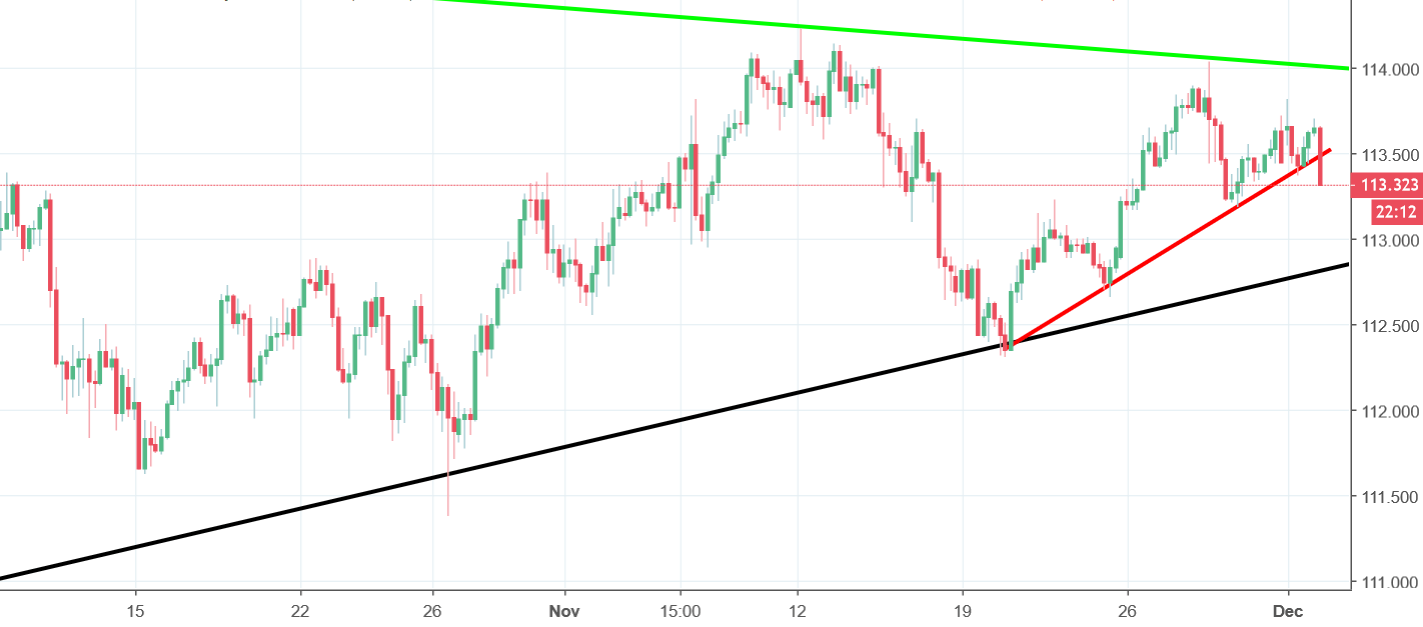
Last we touched upon USDJPY about a month ago when we took a positive stance on the currency pair and expected it to rise in the future. There was a typical market movement and a sharp spike breaking the resistances which changed our stance to a positive one and triggered a buy signal. In the mid-term, our analysis thus turned out to be right. The price increased over 100 pips in under 2 weeks and then bounced from the upper line of the triangle formation. After the reversal, it declined further and bounced back one more time to go up again.

The price tested the resistance one more time and ended up the same way i.e bouncing back and dropping. These movements have traced out a head and shoulders pattern. The technical analysis suggests a negative movement in such a case. As the price already broke the neckline shown in red on the graph above, the signal is on and we expect to see a further drop in price in the nearest future. This time, the price will be aiming for the lower line of the symmetric triangle pattern. We are taking a negative stance on the movements and expect more decline to occur in the future.


Comments (0 comment(s))