USDJPY Analysis – what does the future hold for the currency pair?

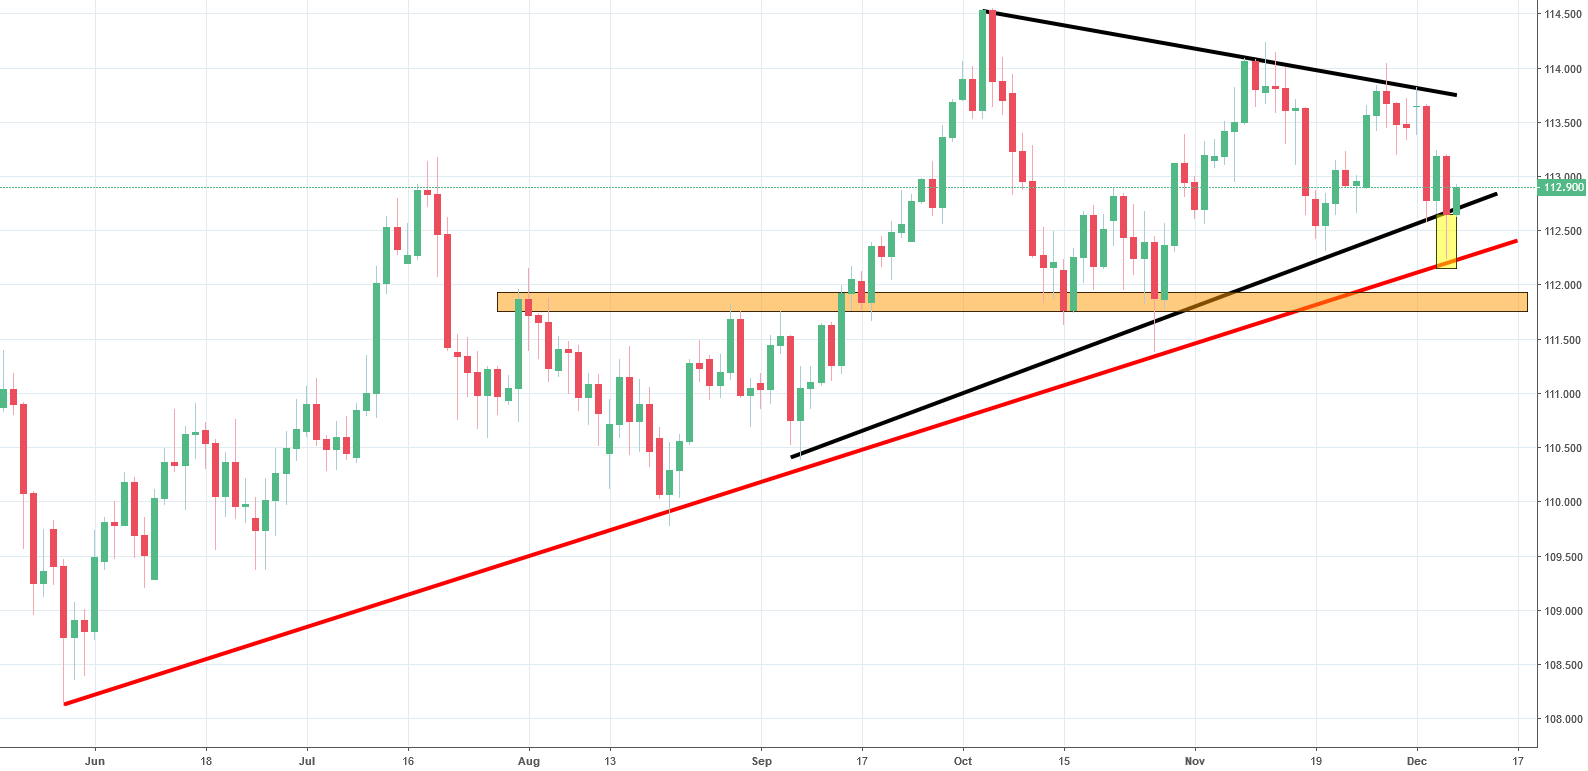
USDJPY, much like most major currency pairs, has been going through interesting price movements motivated by the current political climate. On Monday we took a negative stance on the price and expected it to decline in the coming days. At that time, the price stood at 113.30 and was tracing a negative formation. Furthermore, the price had just broken a neckline and technical analysis suggested more decline to come. The price, in case of a drop, would be aiming at the lower line of the symmetric triangle.

Our predictions were right as the price started to decline almost immediately after. Although yesterday’s decline of more than 100 pips might lead some traders to think that the price has broken out of the symmetric triangle pattern shown on the graph above with black lines, there’s another factor to consider. In addition to the triangle, there’s also a long-term uptrend line shown in red, which can be used as a support line. This support could prompt a bullish reversal. Another factor reinforcing this idea is that the candle formation from yesterday has a long tail. This is usually a sign of a bullish reversal. That is exactly what the price seems to be following, which is why we are maintaining a positive outlook on the price as long as it is above the orange horizontal line.


Comments (0 comment(s))