WTI Oil Analysis – volatility before the OPEC meeting

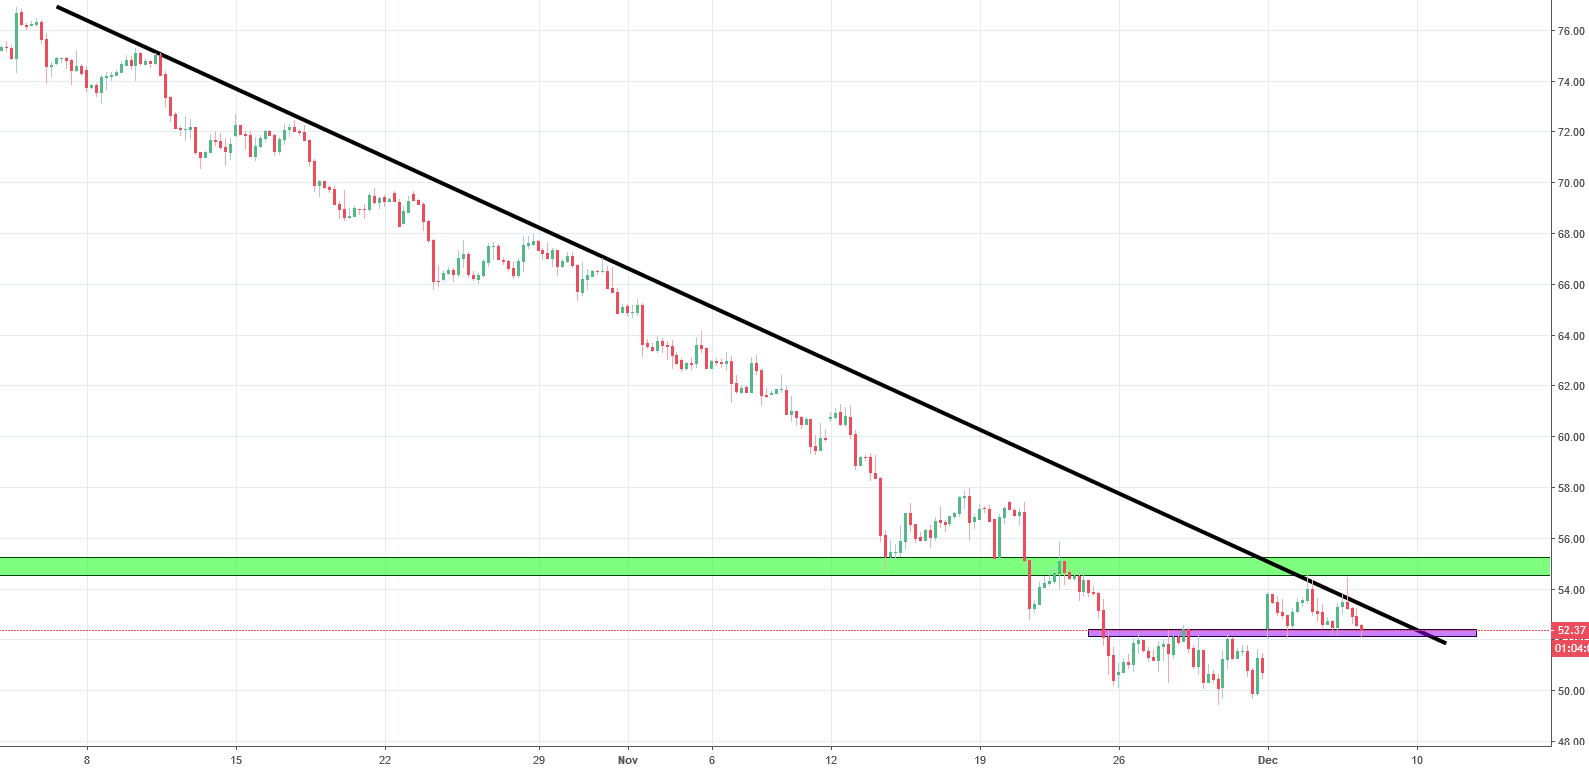
Oil has been an interesting topic of debate for many people in the current political climate. As its price is on the line with the latest developments and an OPEC meeting, it is interesting to look at the movements from the technical point of view. Last time we discussed oil was about two weeks ago when the price was going through a bounceback after hitting the resistance line shown on the graph below in green. The resistance was at 61.8% Fibonacci. This was one of the biggest supports for the price in the mid-term and its breach issued a very strong signal of a further decline. The buyers still attempted to reverse the momentum but the green line will prove a hard resistance to break. Considering all of this, we took a negative stance on the asset and expected it to continue the decline.

As expected, the price continued to decline until the end of last week, when there was a bullish gap in the price attributed to the meeting of Xi Jinping and Donald Trump, which assuaged the worries about the trade war. Although these might have bumped the price in a short term, we still think that the current movements in oil price present a good opportunity to go short. The bump in price has brought it to the green resistance once again, which reversed the price. After the bounceback, the price started to trace what looks like the head and shoulders pattern. Furthermore, the long-term downtrend line shown in black is tested as well. We consider this to be a good signal to go short but the OPEC meeting could change the picture completely.


Comments (0 comment(s))