Dash Analysis – the future looks gloom for the cryptocurrency

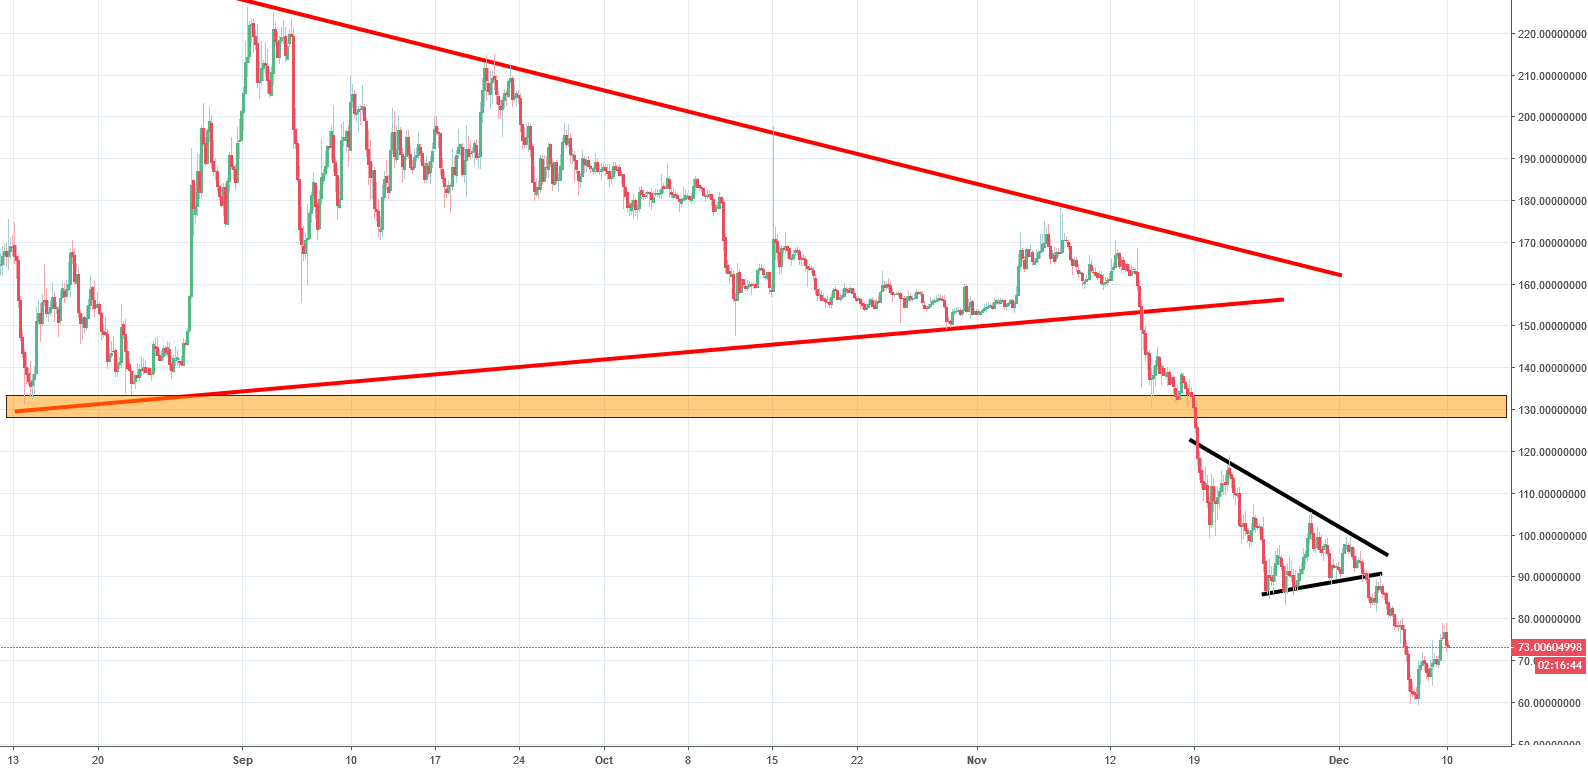
During the second week of September, it looked like Dash would start to make some gains, but the technical analysis pointed out a strong barrier in the form of resistance on $220. Although there was a buy signal, we advised against making any big decisions as long as the price remained below that resistance. If there was a breakout, it would give a definite sign of selling but the chances of a bearish bounce were present as well.

The price continued to move sideways without breaking the resistance line until the middle of November when the price started to trace out a symmetric triangle pattern shown on the graph above with red lines. As the price breached the lower line of the triangle, it dropped sharply by over 50%. Although there was an attempt at reversal, it wasn’t a strong one and looked like a mild correction. As long as the price of Dash remains below the resistance line shown in orange, we will continue to hold a negative outlook on its future movements.


Comments (0 comment(s))