
Aeternity Analysis – three descending triangles in a row!

Aeternity might not be the most famous cryptocurrency out there but it is definitely an interesting one for technical analysis. We looked at the currency in September when its price stood at about $1. We took a bullish stance on it as there was a 10% jump in its price. During the upswing, it also broke a major downtrend line which further reinforced our stance. We expected the movement to trigger a bullish correction, but only if the price managed to keep above the lows.
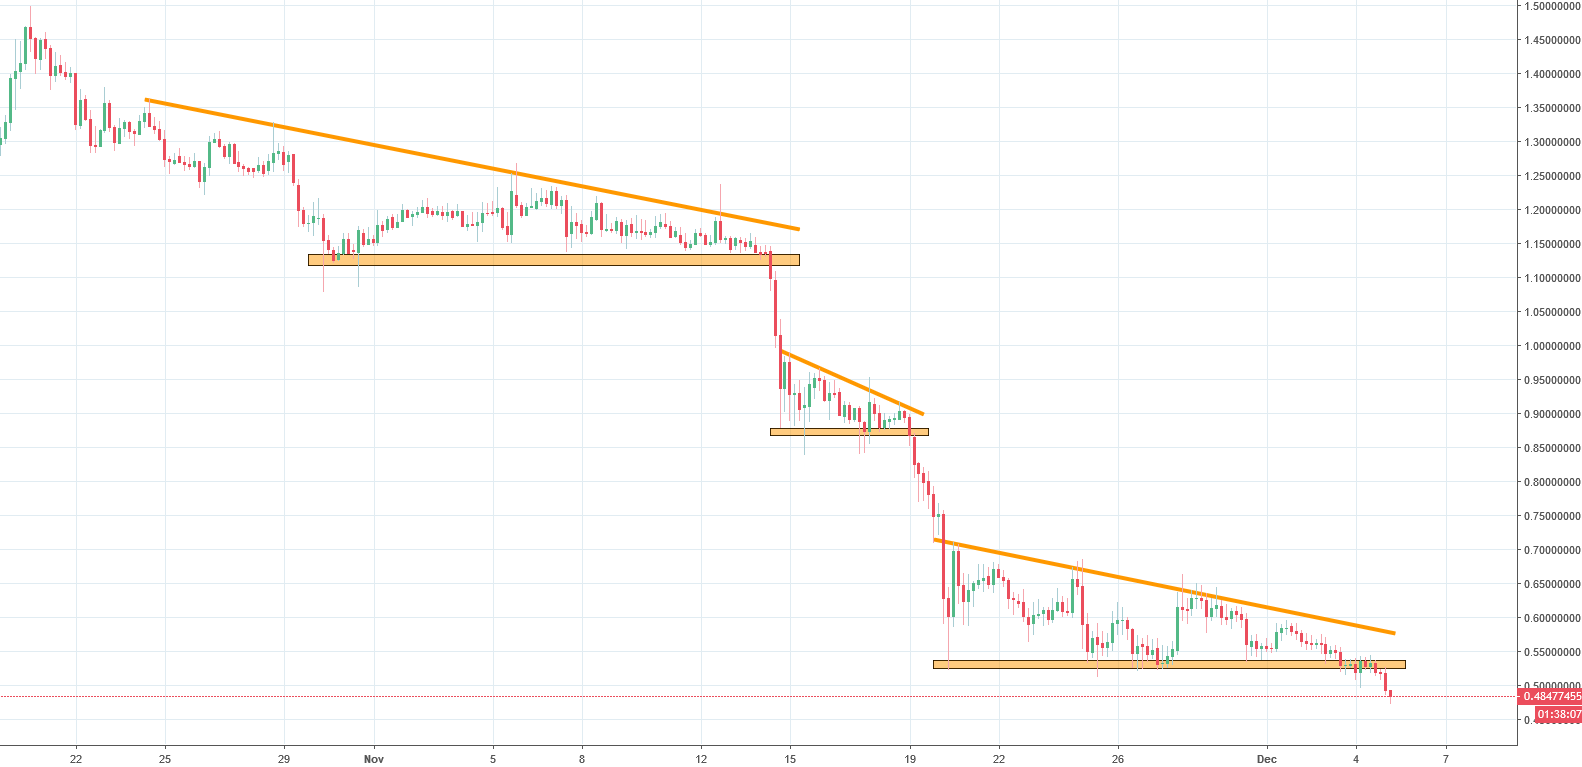
Our prediction turned out to be right in the mid-term as the price gained 50% over the local tops on October 20th. Unfortunately, it didn’t keep that momentum and declined shortly thereafter, but those who took a bullish stance on the cryptocurrency should’ve still been able to rake in some profits. Currently, the price stands at $0.48, which is a big decline from the levels mentioned above. It should also be noted that the price follows the logic of technical analysis very well. It traced out three different descending triangles one after another, shown on the graph above with orange lines. Each time the price broke the lower line of the triangle there was a sharp decline. The latest breach also followed this logic, which is why we are taking a negative stance on the cryptocurrency and expect it to continue declining in the future.


Comments (0 comment(s))