
AUDUSD Analysis – all signs lead to the same conclusion

Last time we touched upon AUDUSD about two weeks ago, there was a gap in the price movements, which we expected to close and it did indeed do so. Furthermore, it exhibited a strong bearish momentum as the price was breaching the support line and indicated a reversal. If the price dropped below the right shoulder, we expected it to trigger a strong sell signal and decline sharply.
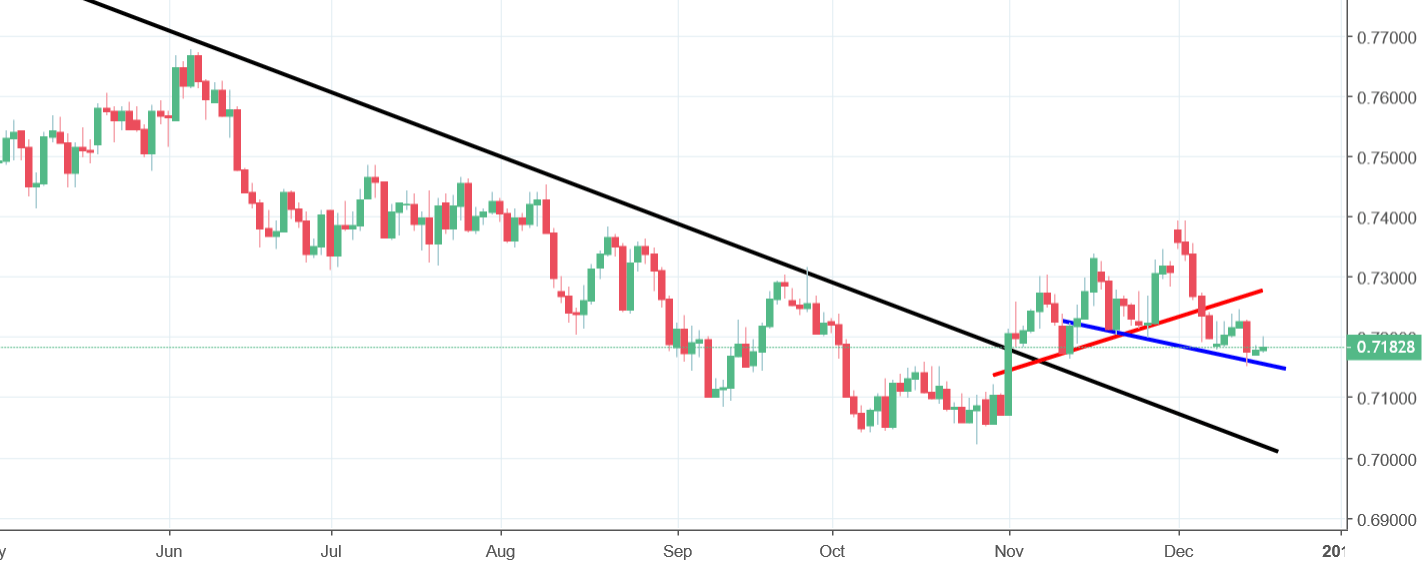
Our predictions turned out to be right as the price continued its decline and eventually triggered a sell signal. Furthermore, it started to trace out a triple top formation, the neckline of which is shown on the graph above with a red line. This formation is suggestive of a further decline. Reinforcing this idea, there is an inverse head and shoulders pattern as well, with a neckline shown in blue. If this wasn’t enough, there are daily candles as well as we see strong drops and moderate recoveries in the price. What this means, is that after the price recovers a little, we should expect it to drop even more. Based on the technical analysis and recognizing the obvious downtrend, we maintain our negative outlook for the instrument.


Comments (0 comment(s))