
CADCHF Analysis – triangle inside of a triangle

CADCHF, a minor pair, has been going through some interesting price movements lately. The currency pair has been quite stable in the past few weeks and the technical analysis suggests that a major movement in the price could occur in the nearest future. The price has been tracing a large symmetric triangle pattern which is shown on the graph below with black lines. What’s interesting about it is that there’s another smaller triangle pattern drawn with red lines inside of the larger one. The price right now is nearing the lower red line of the smaller triangle pattern which, if breached, could trigger a sell signal. In addition to this, the level coincides with a horizontal support line shown with a purple line. The breach of both lines means a strong sell signal.
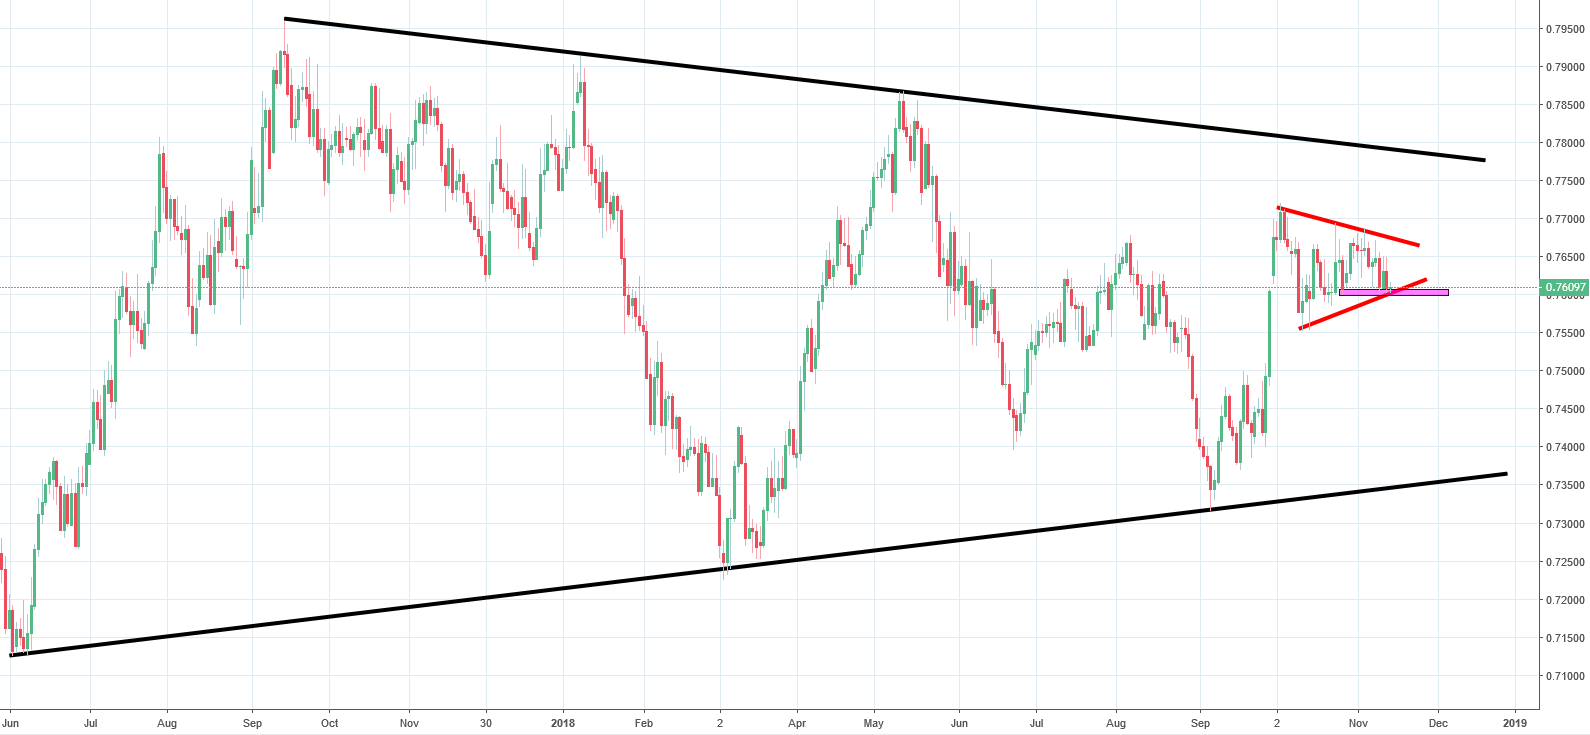
If the price manages to bounce back from the current levels it will reinforce the support line. Furthermore, if after the bounce the price manages to break the upper red line of the triangle pattern, it will trigger a buy signal. We believe that it is more likely that the price will fall below the support level and trigger a sell signal.


Comments (0 comment(s))