
DAX Analysis – will the price break the neckline to trigger a buy signal?

DAX has been following an interesting pattern for technical analysis in the last couple of months. About a month ago, we took a bearish stance on the index as we saw a decline highly likely. Technical analysis suggested a bearish breakout as well, as the price had broken a neckline of a head and shoulders pattern, shown on the graph with a pink line. This triggered a sell signal and the price, following the logic of technical analysis, dropped immediately after.
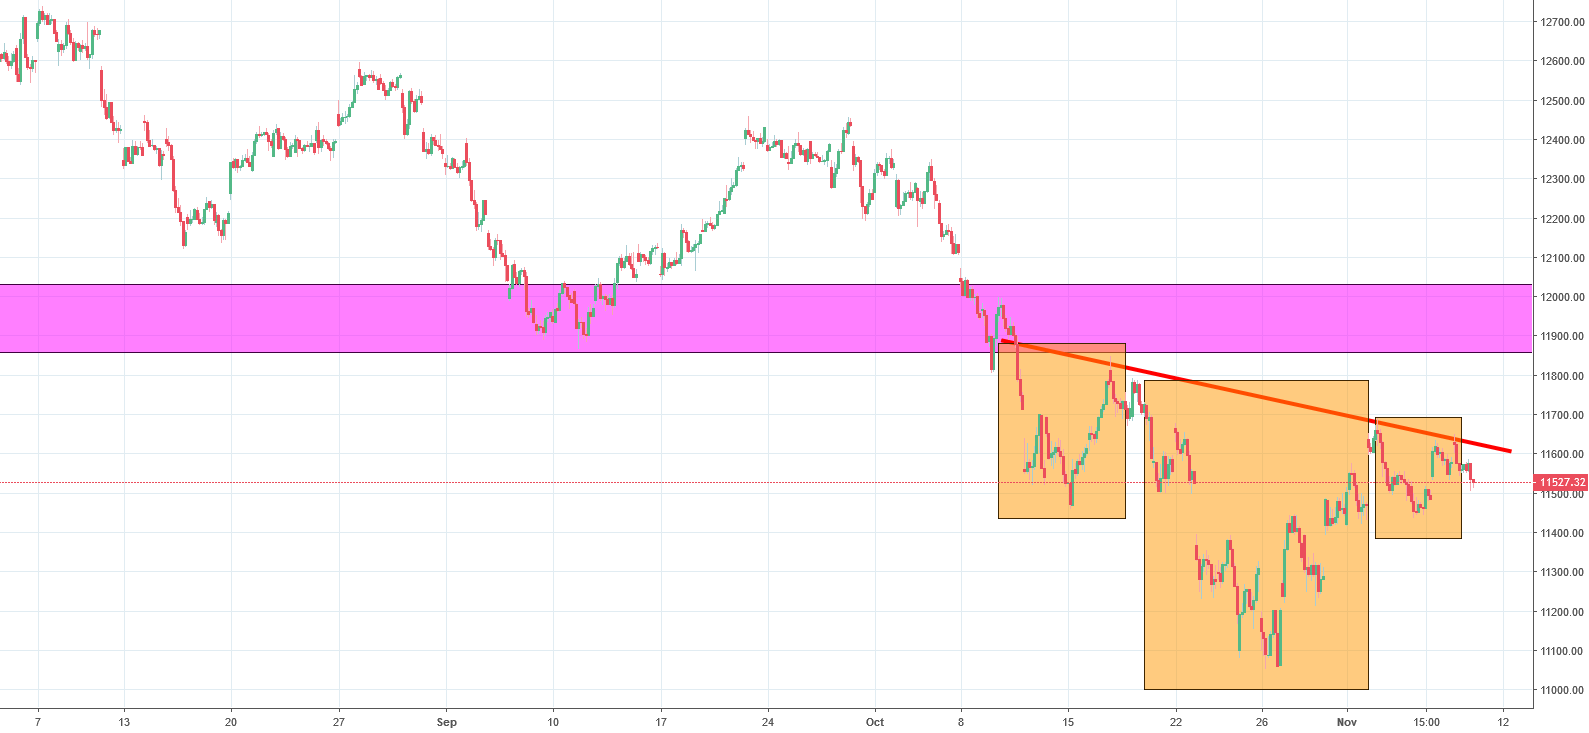
The uptrend line was broken as we tested a new support at the level of around 11000 points. During the last days of October, the price reversed and formed an inverse head and shoulders pattern, which is highlighted on the graph above in orange. This pattern is suggestive of a bullish sentiment in the future, but in order for that to happen, the price has to break the neckline. As of today, the price remains below the neckline, which is shown on the graph with a red line. If the price remains below that level for an extended period of time, we expect a further decline. On a more general note, the sentiment for the index is still negative as long as the price remains below the resistance line.


Comments (0 comment(s))