
Dollar Index Analysis – wedge pattern and a buy signal in sight

USD has been experiencing a lot of movement in the recent period, which is bound continue as the FOMC will soon announce its decision on the interest rates. About two weeks ago, we took a bullish stance on the currency and expected it to break the resistance similarly to how it broke another similar trendline at the end of September. The trend lines are shown in red on the graph below.
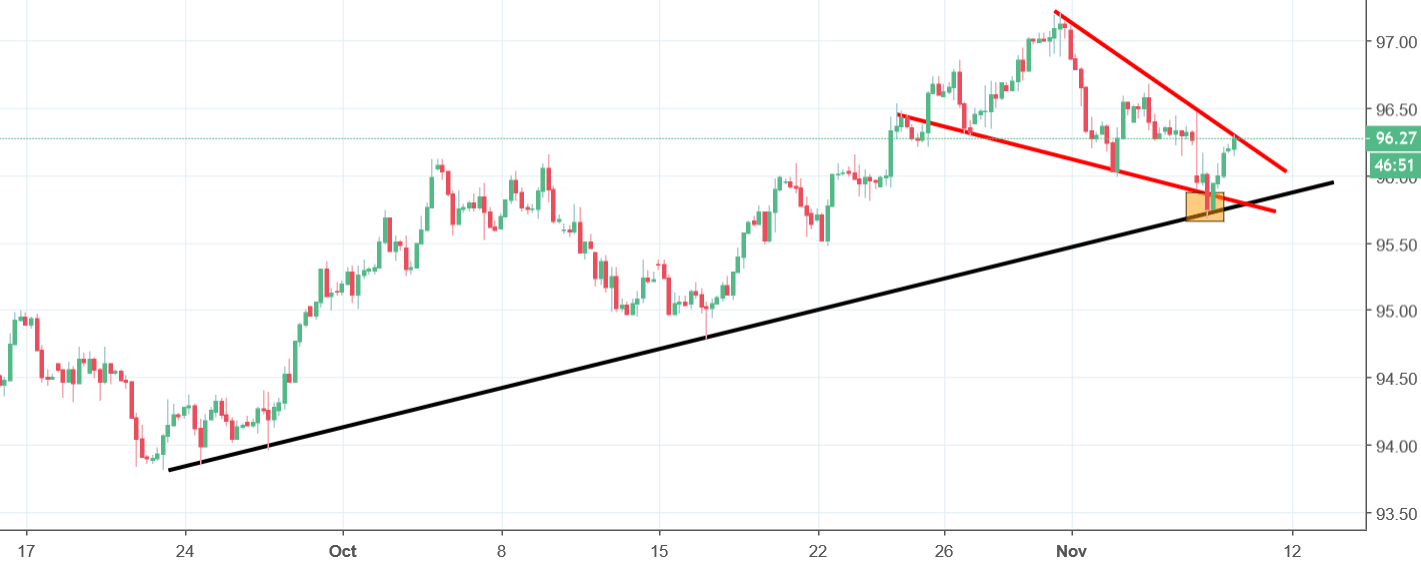
Following the logic of the technical analysis, the price started to increase throughout October. November, on the other hand, introduced a negative sentiment in the price movements as a correction took place. With the correction, the price traced out a head and shoulders pattern. During this movement, the price also broke the neckline shown in red on the graph above. It is the lower of the two red lines. Technical analysis suggests that this should’ve triggered a sell signal, but instead it looked more like a false breakout, considering the price bounced back soon after hitting the mid-term uptrend line, which is drawn in black on the graph. This changed the picture and the price movement started to look more like a wedge pattern than a head and shoulders pattern. This wedge pattern suggests a further increase in the price. If the price manages to break the upper red line, it will trigger a strong buy signal.


Comments (0 comment(s))