
Dollar Index Analysis – history repeats itself!
We analyzed the Dollar Index about a week ago when we took an optimistic stance on the currency but saw a chance of a head and shoulders formation, which would lead to a bearish outbreak. Still, the price would have to break the neckline in order for the sell signal to be triggered and as it was above the line, chances for that weren’t very high.
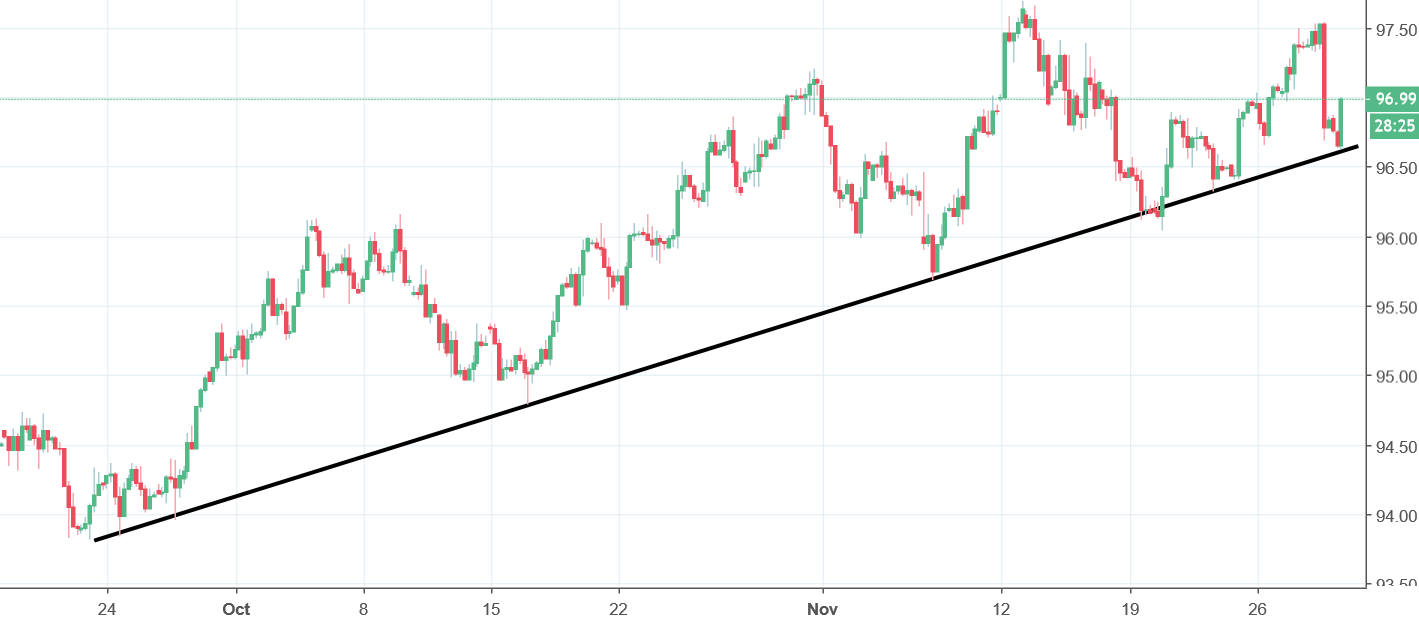
Like predicted, the price continued to increase, but only till yesterday. On Wednesday there was a reversal and a sharp drop as the Dollar Index started to test the neckline one more time. Although this time the right shoulder looks slightly different, the scenario is very similar to what was happening a week ago. The black uptrend line shown on the graph above held as the price bounced back after hitting it. This reinforces the support and is crucial for the technical analysis. As for the sentiment, as long as the price remains above the support, the buy signal is on. On the other hand, if it breaches the line from above, it will trigger a sell signal.


Comments (0 comment(s))