
GBPUSD Analysis – sideways trend and a H&S pattern!

Last time we discussed the GBPUSD currency pair was on November 28, when the price was nearing a support line and was in an extremely interesting position for the traders. The price had recently experienced a bounce and we suggested two strategies to the traders. One was to buy and expect a bullish correction while placing a stop loss order at 1.27. Another strategy was to sell if the price broke the lows from the previous day.
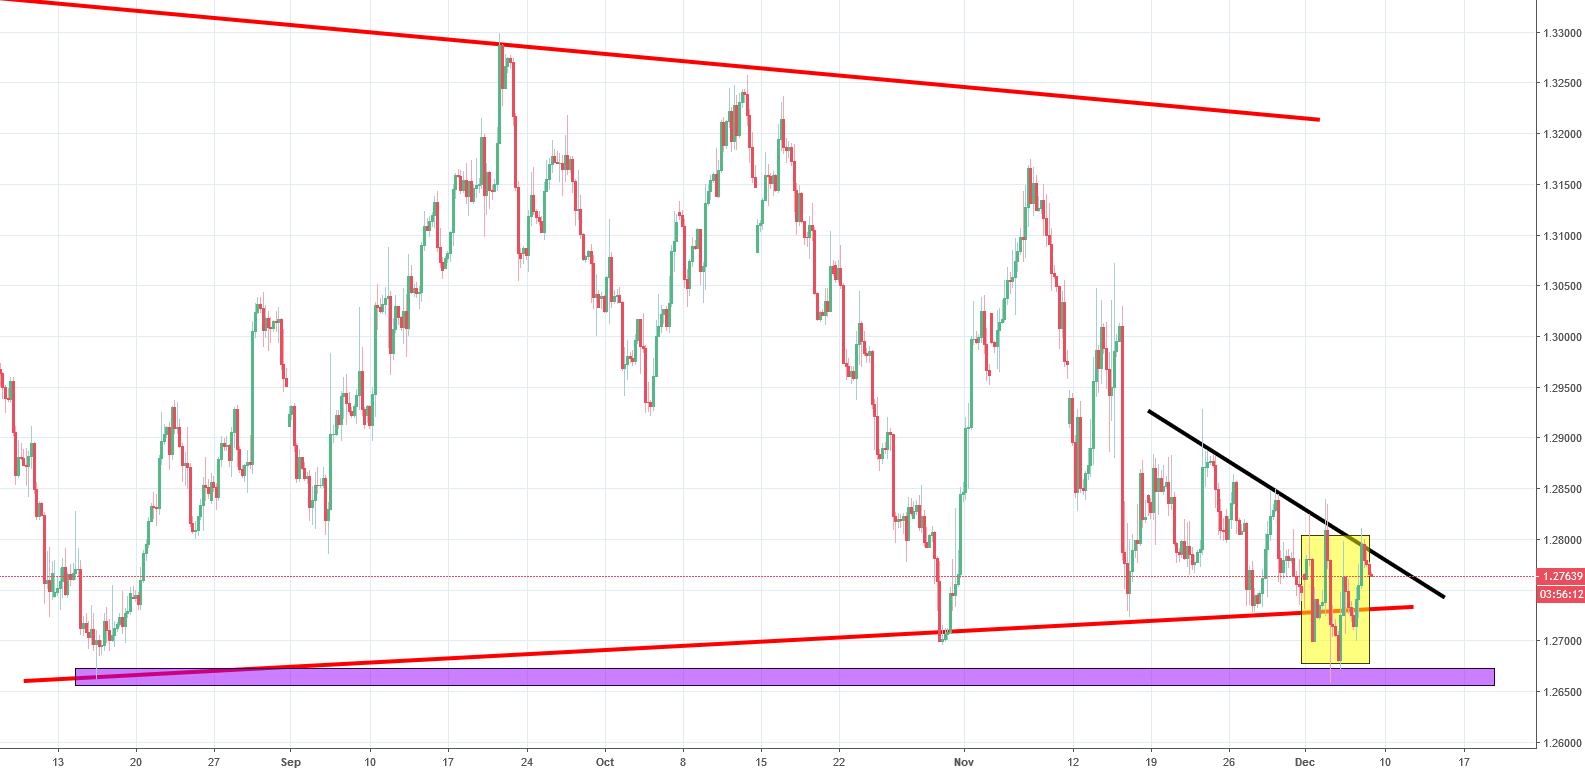
The situation turned out to be a little bit trickier than expected. We underestimated the volatility in price. What happened was that the price went lower first, before reversing and then reversing again a few times. This meant that the price was following a sideways trend and there was no ‘real’ movement. It is also interesting to look at how the support lines behaved during these movements. The only one that held was the line from August which is shown on the graph above in purple. For the resistances, the downtrend line which is shown in black held. Currently, the price has traced out a head and shoulders pattern highlighted in yellow. This could be suggestive of an upward movement. Nevertheless, we abstain from giving any clear directions before the voting which is supposed to take place in the following week.


Comments (0 comment(s))