
Gold Analysis – flag pattern and a possibility of a breakout

Gold has always been an interesting asset for technical analysis as it reflects the general market sentiment and can be used to draw broad conclusions. Two weeks ago, gold price movement was indicative of a bearish sentiment. The price was expected to decline after a false breakout pattern as it crossed the orange line on the graph below. The price at that time stood at around 1230 USD/oz.
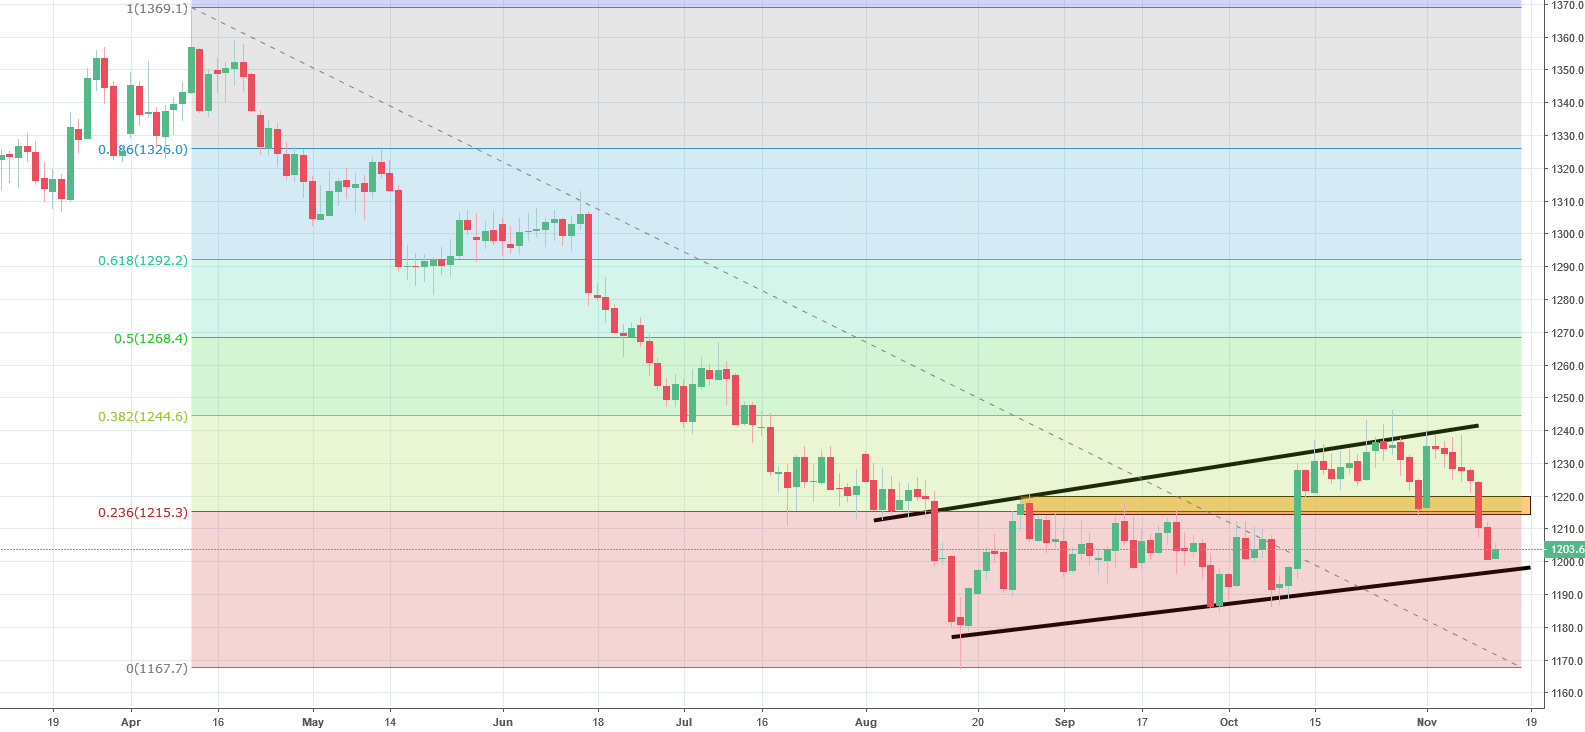
Currently, the price of gold is at 1204 USD/oz, so it did indeed decline per our analysis. The price broke the support line at 38.2% Fibonacci shown on the graph above in orange on November 9. Now, the price is tracing a flag pattern shown on the graph with black lines. This is suggestive of a further decline as it represents a trend continuation pattern. A contributing factor to the decline is the strength of the US dollar. If the price manages to decline below the level of the lower black line of the flag pattern, it will trigger a sell signal. We consider this to be a likely scenario and expect the price to decline in the nearest future.


Comments (0 comment(s))