SiaCoin Analysis – steep but predictable drop

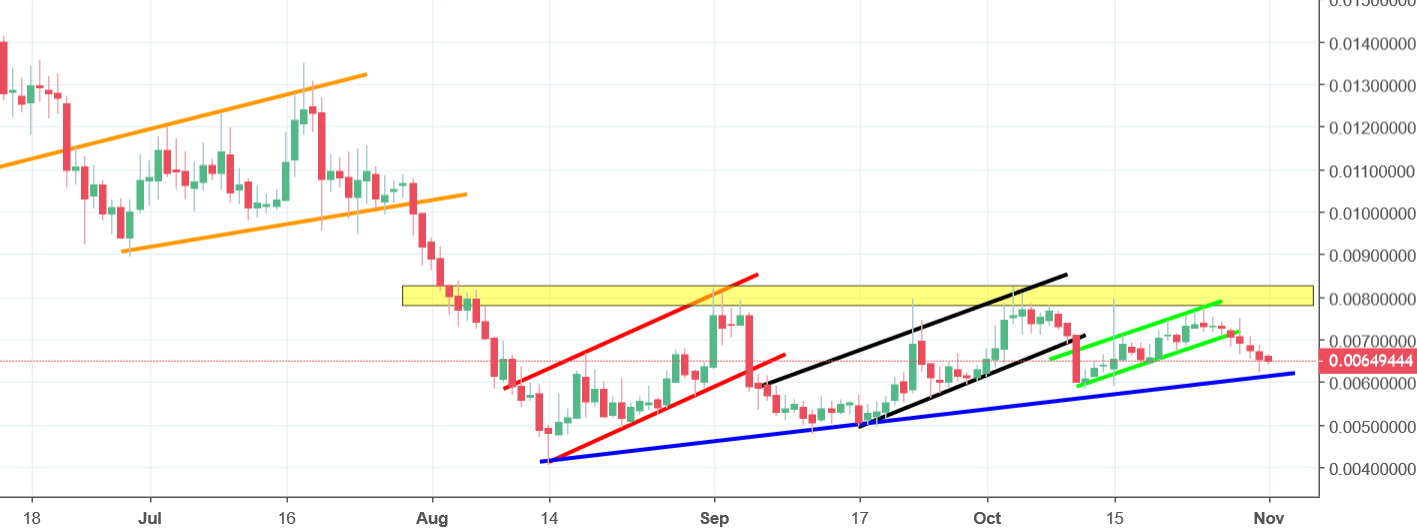
SiaCoin is experiencing heavy losses as it drops by nearly 14%. It should be noted that the price movement of the asset is following the logic of technical analysis and can be predicted with relative ease. The recent drop wasn’t a surprise either. About three weeks ago the price was exhibiting a flag pattern, which led us to take a bearish outlook as we expected a drop in the nearest future. As soon as the price crossed the black line shown on the graph below, we expected a bearish breakout, which is exactly what happened.

After the price breached the black line and dropped, it started to trace another flag pattern which is demonstrated with green lines on the graph. A few days ago, the price broke the support once again and dropped sharply. This time, the drop continued for a bit longer and has now lasted 6 days. Although the price has traced the flag pattern a few times now, there is a general trend of an ascending triangle pattern in the bigger picture. The price seems to be nearing the support of this trend as well and if it crosses the line shown in blue, a strong sell-signal will be triggered and a drastic drop in price should be expected.


Comments (0 comment(s))