
S&P 500 Analysis – price breaks out of the sideways trend

S&P 500 has already been quite volatile in recent times as the index entered a bearish territory terrifying many investors. The recently renewed tensions between China and the US have only exacerbated the situation leading the index to start the week not so well. On November 23 we saw the index trace out a similar path to what it experienced during the start of the year and expected the price to decline further to reach the horizontal support line shown on the graph below in yellow.
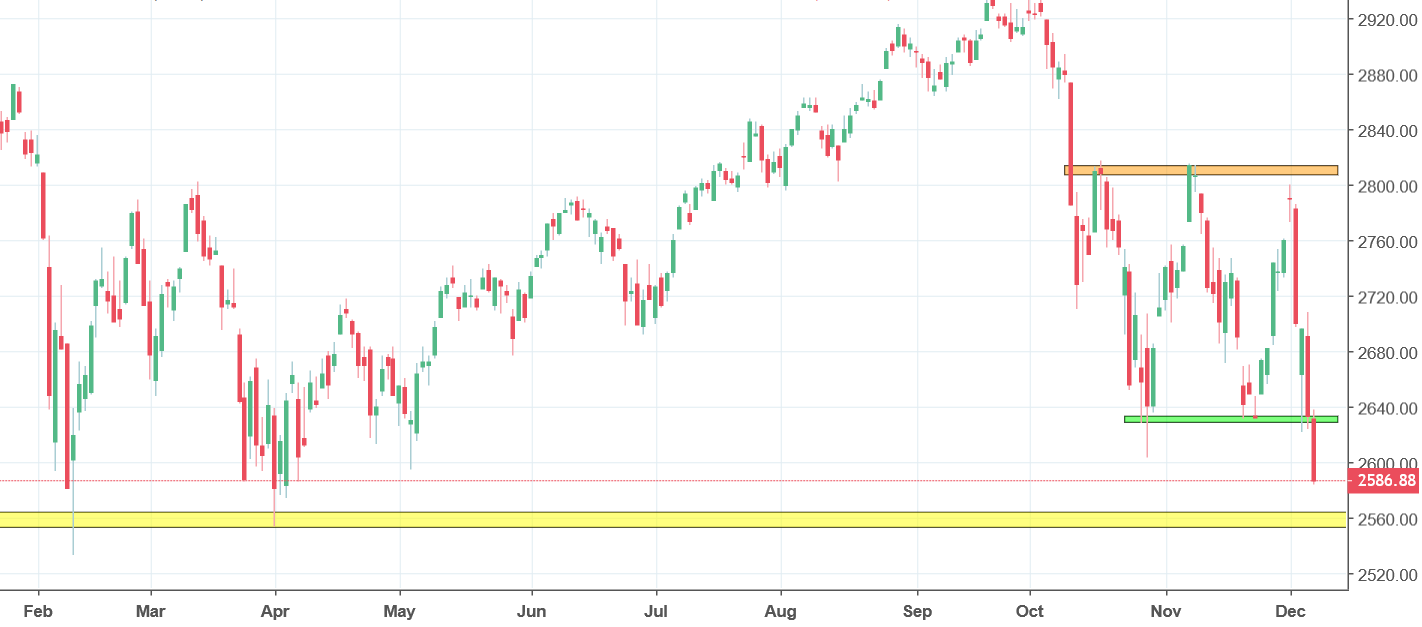
While the index still has 40 points to cover to reach our predicted level, the direction is definitely right. The index triggered a sell signal after breaching the green horizontal support. The support was established by a sideways trend that the price was following since the middle of October, locking in the index between the orange and green lines. Now, as the price broke the lower line of the sideways trend, we take a bearish stance on its movements. While there are chances that the breakout was a false one and the price will come back above that level to trigger a buy signal, we don’t consider that a likely scenario.


Comments (0 comment(s))