
S&P 500 Analysis – more decline or an iH&S?

Everyone around the world is watching the S&P 500 as there seems to be a crucial point where it is decided whether the economy enters a long-term downturn or it continues the decade-long path of growth. The index has experienced quite a volatility which was partly caused by political uncertainty. About a week ago, the index was in a bullish territory for a short period of time as it saw a week-long growth after the infamous decline. We didn’t fail to notice that the price behavior, although suggestive of a positive sentiment, was all too similar to the movements at the beginning of the year when the short-term growth ended in new lower lows for the index.
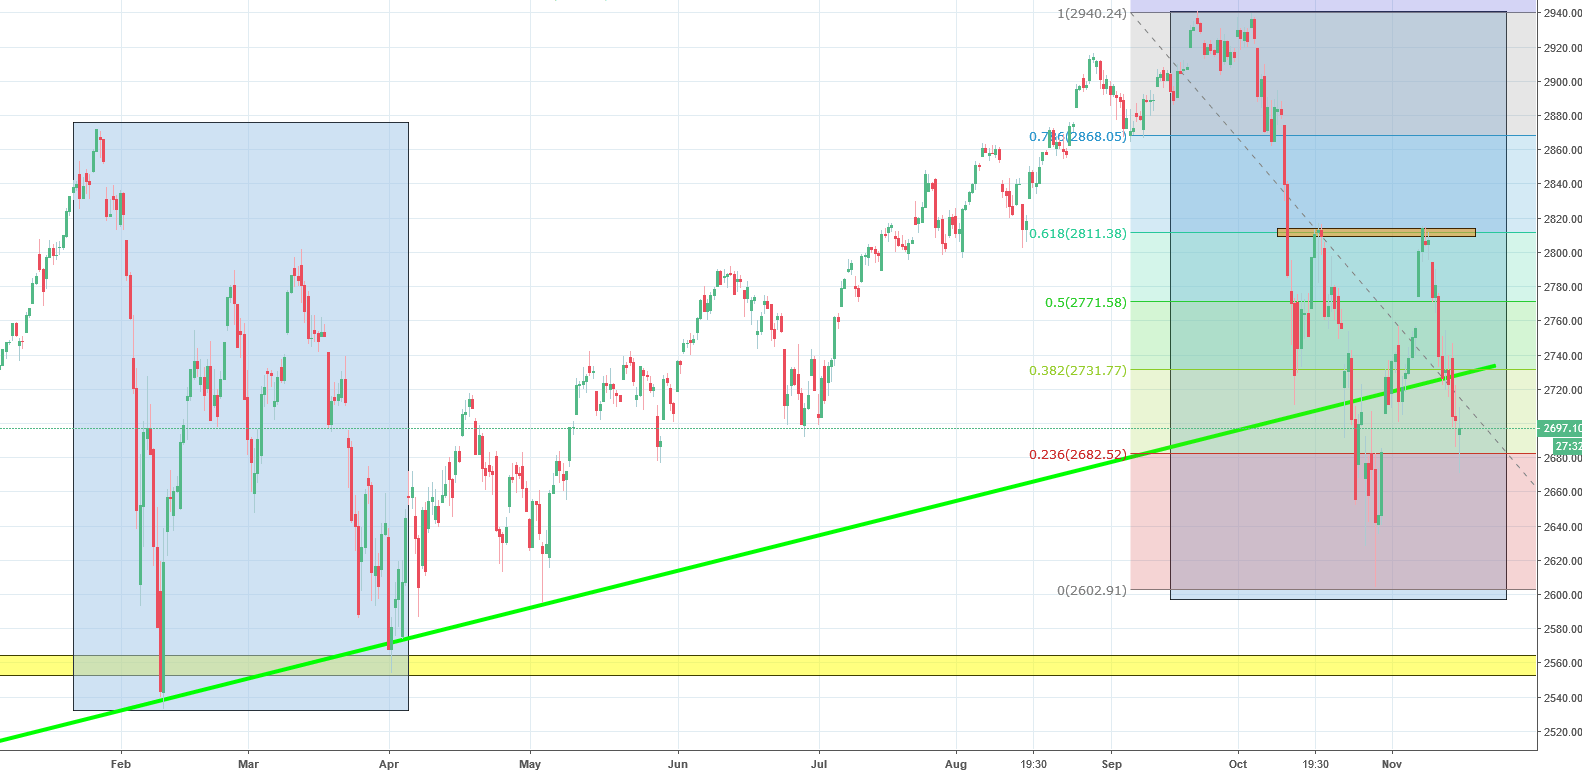
Our worries turned out to be right. Immediately after hitting the resistance at 61.8% Fibonacci, outlined on the graph above with an orange line, the price bounced back. The resistance established by this movement will be very important in the future technical analysis. If the latest session finishes on the green side it will be tracing out a right shoulder, which would make the orange resistance a neckline. In addition to this, the price also breached the long-term uptrend line which is shown in green. This is suggestive of more decline and means that the sell signal has been triggered. On the other hand, if the price is exhibiting an inverse head and shoulders pattern, then there is hope that the current movement will end in growth, but this is not a reason enough to take an optimistic stance on the price movement.


Comments (0 comment(s))