
S&P 500 Analysis – correction equality pattern proves right

S&P 500 has been going through a highly publicized decline. The index has experienced losses that have forced many analysts to take another look at the long-term economic outlook. Nevertheless, the technical analysis predicted a bullish reversal. We recognized the correction equality pattern in the price trend, which is highlighted in blue on the graph below. The pattern was similar to another correction which occurred at the beginning of 2018 and ended in a reversal.
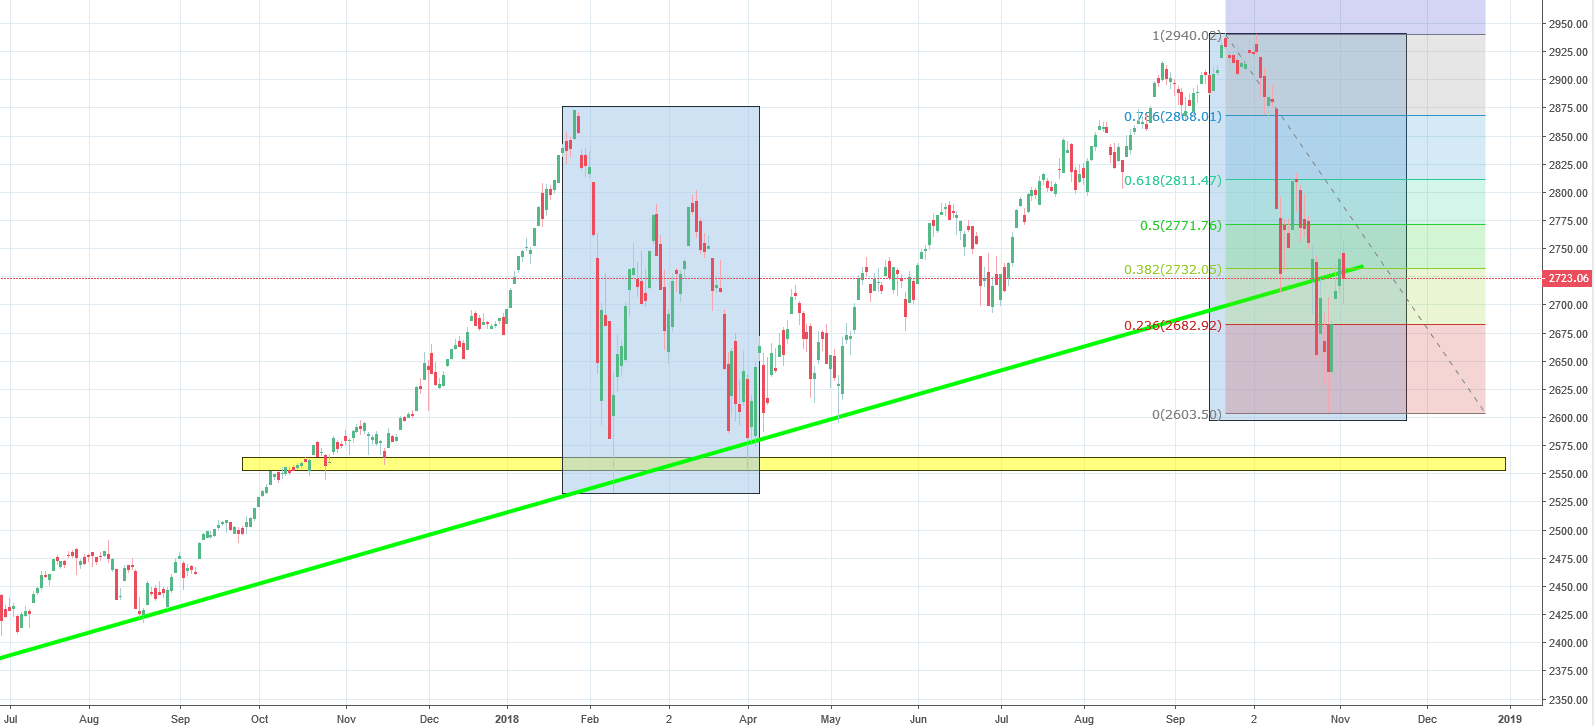
Our expectations were proven right as the price used the correction equality pattern as a trigger to bounce back. The decline wasn’t extremely deep either. It reached 38.2% Fibonacci as the bullish sentiment took over the markets again. If we compare the current trend to the past experience, the decline isn’t over. There will likely be a dip in the price in the nearest future. We are taking a negative outlook for the index for the coming weeks.


Comments (0 comment(s))