
S&P 500 Analysis – signs of a recession!

S&P 500 is one of the most widely used indexes which is followed by many analysts and ordinary readers around the world. Its movements are often used to predict the future of the economy, which is why a lot of attention as been focused on it as it started to exhibit an out-of-the-ordinary behavior these last couple of weeks. We analyzed the index two weeks ago when we took a bearish stance on its movement. We concluded that if the price came back above the resistance, it would only ba a false breakout.
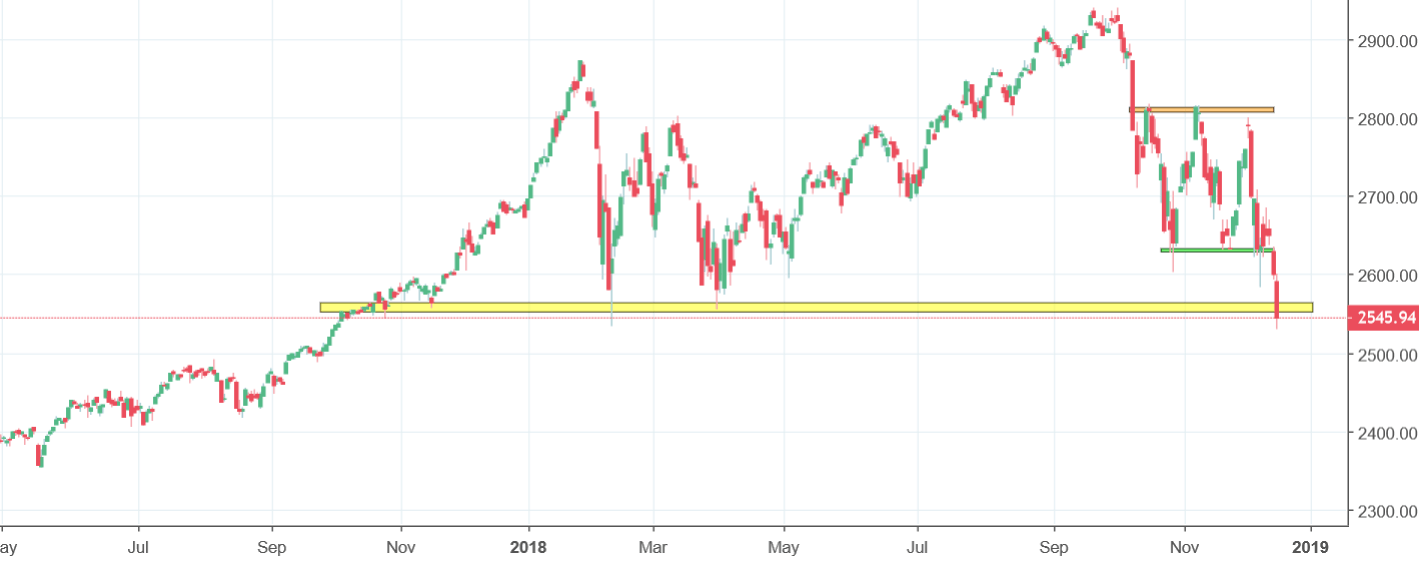
Like predicted, there was indeed a breakout and a false one too. The price came back above the support line but not for a very long time. Yesterday, the price came back down and reached 2550 points which has been a target for a few weeks. Some are awaiting the Santa Rally to save the market, but it is a little too late now. If there was to be any effect on the index, it would’ve already taken place. On the contrary, we believe that the recent movements could be a sign of an oncoming recession. Which presents a great trading opportunity as well. The sell signal remains on and we maintain our negative outlook for the index. If the price comes back above the green resistance, it could be a sign to buy.


Comments (0 comment(s))