
S&P Analysis – a reversal in sight?

S&P 500 has exhibited quite a volatility in the last couple of weeks. The index is reacting to the political and economic uncertainty around the world and establishing new lows and highs. About two weeks ago, the S&P 500 was exhibiting bearish signs but it still managed to stay above the support lines, which led us to believe that there was no cause to take the movements as a sell signal. The movement pattern created a V-shape reversal, which is not unusual for indices of this type. Consequently, there was no reason to be bearish. Nevertheless, the price crossed the support lines from above and plummeted.
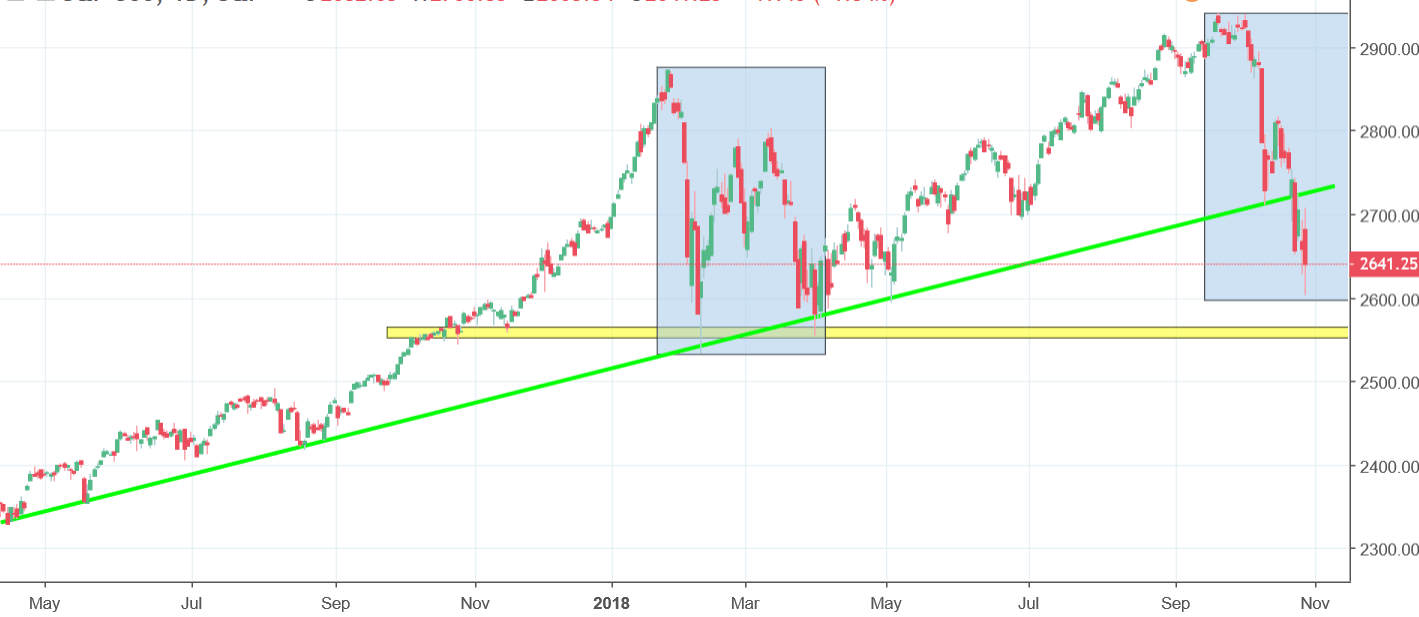
As of now, the price movement is exhibiting a correction equality pattern, which is outlined in blue. We expect the correction to have about the same depth as the one at the beginning of 2018, also outlined in blue. According to this logic, there might be a reversal in sight, but we expect the index to continue dropping until it reaches the support line at 2555 points, shown in yellow.


Comments (0 comment(s))