
S&P 500 Analysis – the index breaches a long-term uptrend line

S&P 500 has been a subject of a lot of discussion lately. The index has been experiencing volatility that gave rise to some speculation on what the future of the financial markets looks like. Only three days ago, we took a bearish stance on the index, but the trend defied the logic of our technical analysis and started to increase. While we still maintain a bearish outlook on the price in the long term, there is an undeniable bullish sentiment in the short run.
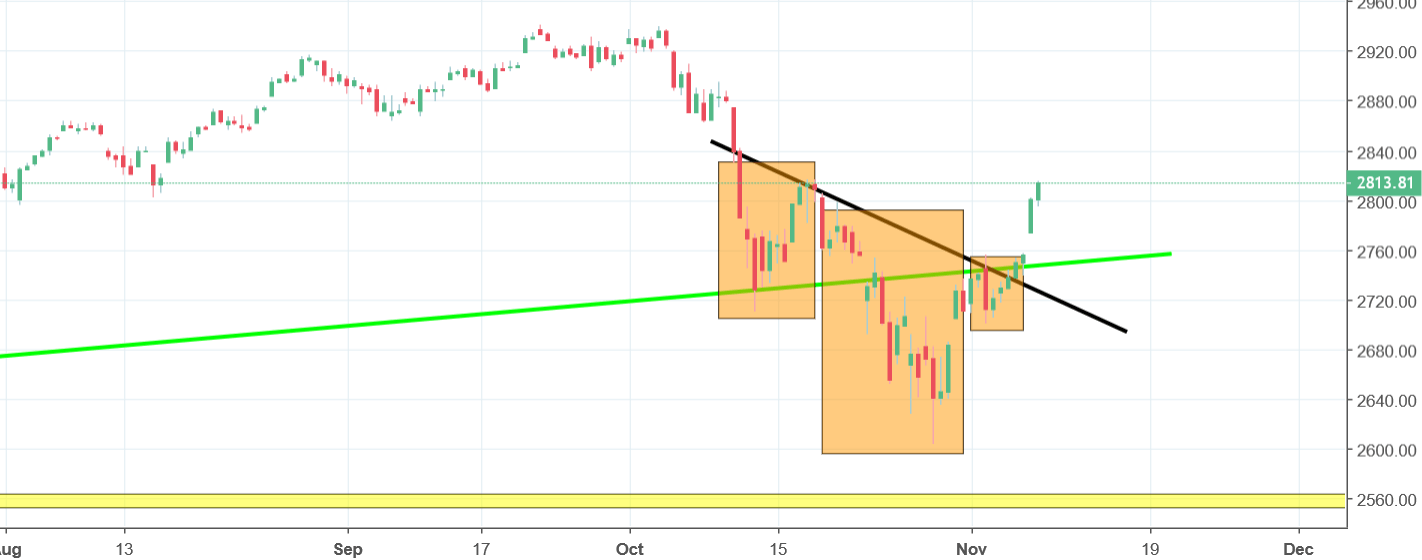
S&P 500 is following an inverse head and shoulders pattern and the price broke the neckline, shown on the graph above with a black line, on Tuesday. During the increase, the price also breached the resistance created by a long-term uptrend line, which is drawn in green. The markets seem to have reacted to the breach of the resistance positively as the index skyrocketed immediately. Taking this behavior into consideration, it is impossible to deny a positive sentiment taking over the market. Nevertheless, it should be considered that the index exhibited a very similar behavior at the beginning of the year, but ended up in making new lows instead of large gains.


Comments (0 comment(s))