
USDCAD Analysis – channel up formation means more growth

USDCAD has recently made new mid-term highs, but it is not necessarily a green flag for the buyers to start buying. On Monday, we took a bearish stance on the currency pair but suggested waiting before taking a short position. The head and shoulders pattern highlighted in blue along with the pressure on the neckline of the mid-term uptrend line could have triggered a strong buy signal if the price broke either milestone. On the other hand, the horizontal support line shown with a yellow line was a good place for the sellers to start going short. As it turned out, the price didn’t break the neckline or the uptrend line. Instead, the head and shoulders pattern turned out to be a triple top formation and no signal was issued.
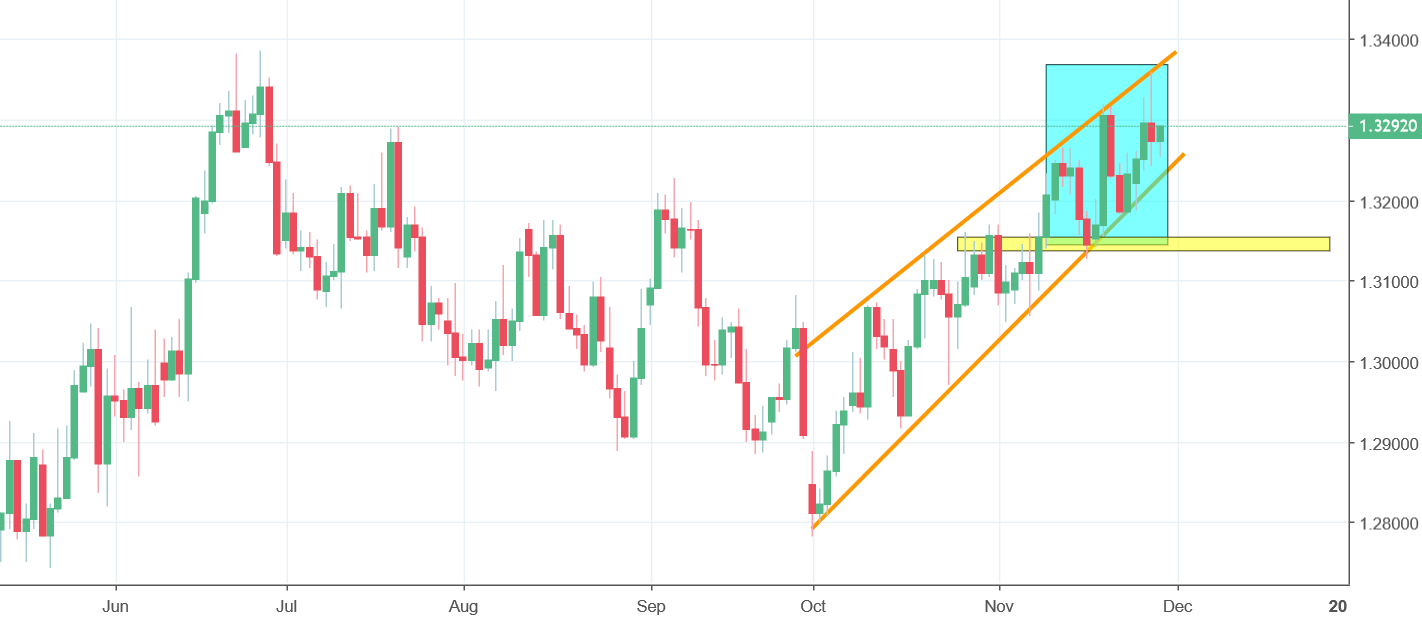
Currently, the price is in a channel up formation which is a good news for the buyers. It’s too early to rejoice though. On the daily chart, the candle is a pin bar, as the price bounces from the resistance. Theoretically, this could lead to a decline, but for a definitive sell signal to be issued, the price would need to break the lower line of the channel up the formation. Decline does not seem very likely as long as the price stays above the horizontal support line.


Comments (0 comment(s))