
USDCHF Analysis – rectangle formation suggests more decline
Last time we considered USDCHF was about a week ago when the currency pair was in an extremely interesting position for the technical analysis. The price was nearing a horizontal resistance shown on the graph below with a green line. The resistance was also the place where the flag formation started and it had been tested before successfully. Consequently, if the price remained above that level no sell signal could be issued, but a breach of this resistance would definitely signal traders to go short and expect the pair to set new mid-term lows.
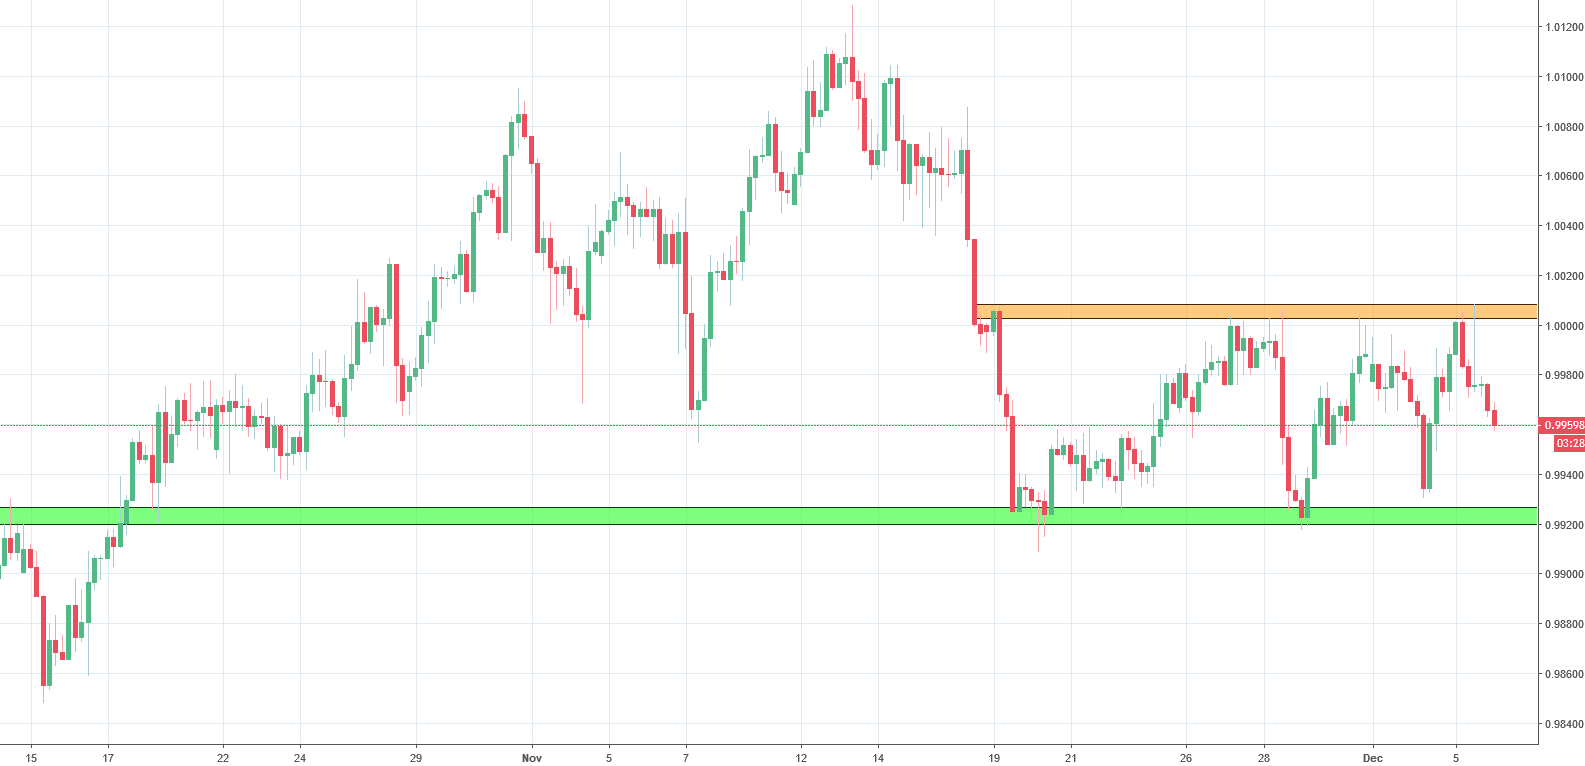
That, however, didn’t happen as the green resistance held its own successfully as the price reversed and started to gain before dropping again and then reversing one more time. During these movements, the price started to trace a rectangle formation which is shown with orange and green lines on the graph above. The price recently bounced from the upper orange resistance with a shooting star candlestick formation. Technical analysis, in this case, would suggest a strong sell signal. We will follow that practice and expect the price of the currency pair to continue its decline in the nearest future.


Comments (0 comment(s))