
WTI Oil Analysis – where does the price go from here?

Oil prices have fallen under a lot of scrutiny lately due to the political tension that surrounds the issue. We saw a great selling opportunity ten days ago right before the OPEC meeting that was supposed to determine the future of oil prices. Disappointing expectations, the meeting didn’t end in any drastic change in the price. On the contrary, the price continued to follow the logic of technical analysis. Ten days ago we saw a head and shoulders pattern as well as the test of a long-term downtrend line, both of which reinforced the negative sentiment.
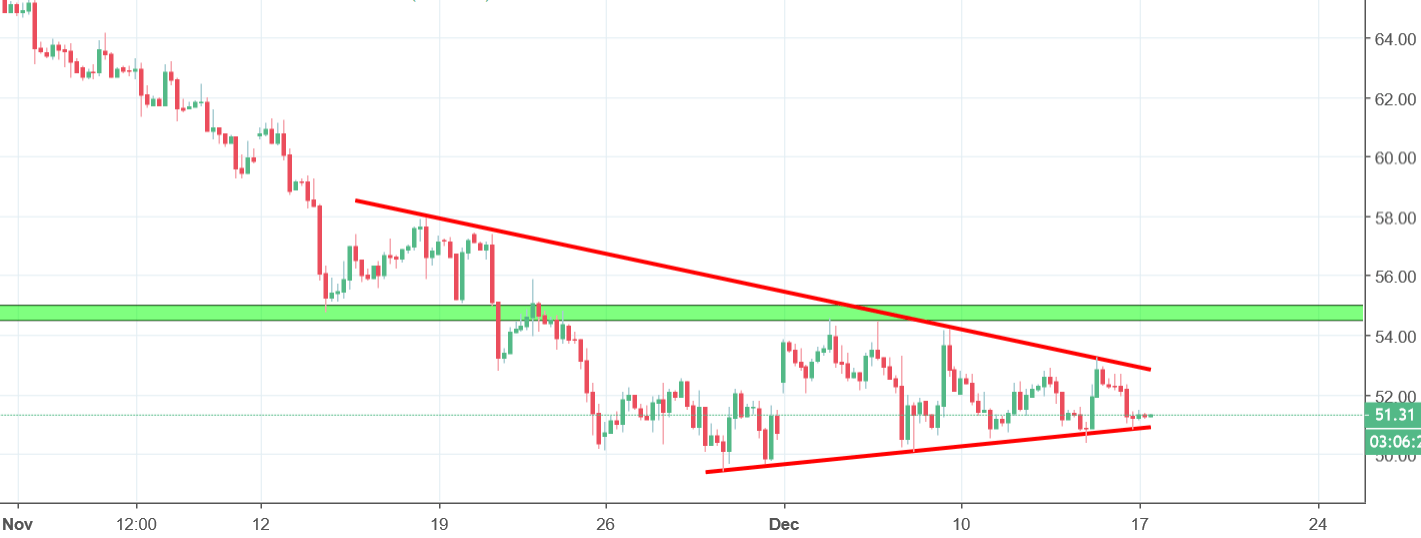
As expected, there was a breakout of the support line and although it didn’t lead to a massive drop, it did follow technical analysis quite well. Currently, there is a sideways pattern in the price movement as it traces a symmetric triangle pattern shown on the graph above with red lines. Today, the price came closer to the support and there are chances of a bearish breakout. If it does indeed close below the lower line of the symmetric triangle, it could trigger a sell signal.


Comments (0 comment(s))